


This policy paper on local council efficiency in Kent is co-authored by Charlotte Gill (@WokeWaste) and Trafalgar Analytics. The authors and contributors have a background in data journalism, data science and finance.
Outline: Local Council Efficiency, Kent
This paper on local council efficiency and waste, focusses on Kent County Council. It builds on Trafalgar Analytics’ earlier work on council waste and school taxis in Kent (2025).
After Reform UK won ten councils in the 2025 Local Government Elections, there has been significant political and public interest into whether Reform will be able to deliver on its promise to “reduce waste and cut taxes”.1
Following America’s DOGE-model, many Reform councils now have a Cabinet Lead for local government efficiency, including Kent.2,3
Building on this, this paper conducts a data review of Kent County spending, and addresses the following questions:
I. Where should DOGE start looking?
II. What the data shows about Kent spending?
III. Root Causes — Fraud? Statutory spending forced by successive Governments? Or a deeper systemic issue?
IV. An illustrative study of runaway spending.
V. Action Points — What are the next steps?
Where should DOGE start looking?
In collaboration with Charlotte Gill, founder of the DOGE-UK Initiative (@WokeWaste), we sourced every expenditure item (invoices above £250, across all 102 categories) spent by Kent County Council, every month between 2020 to 2025.
What the data shows about Kent spending?
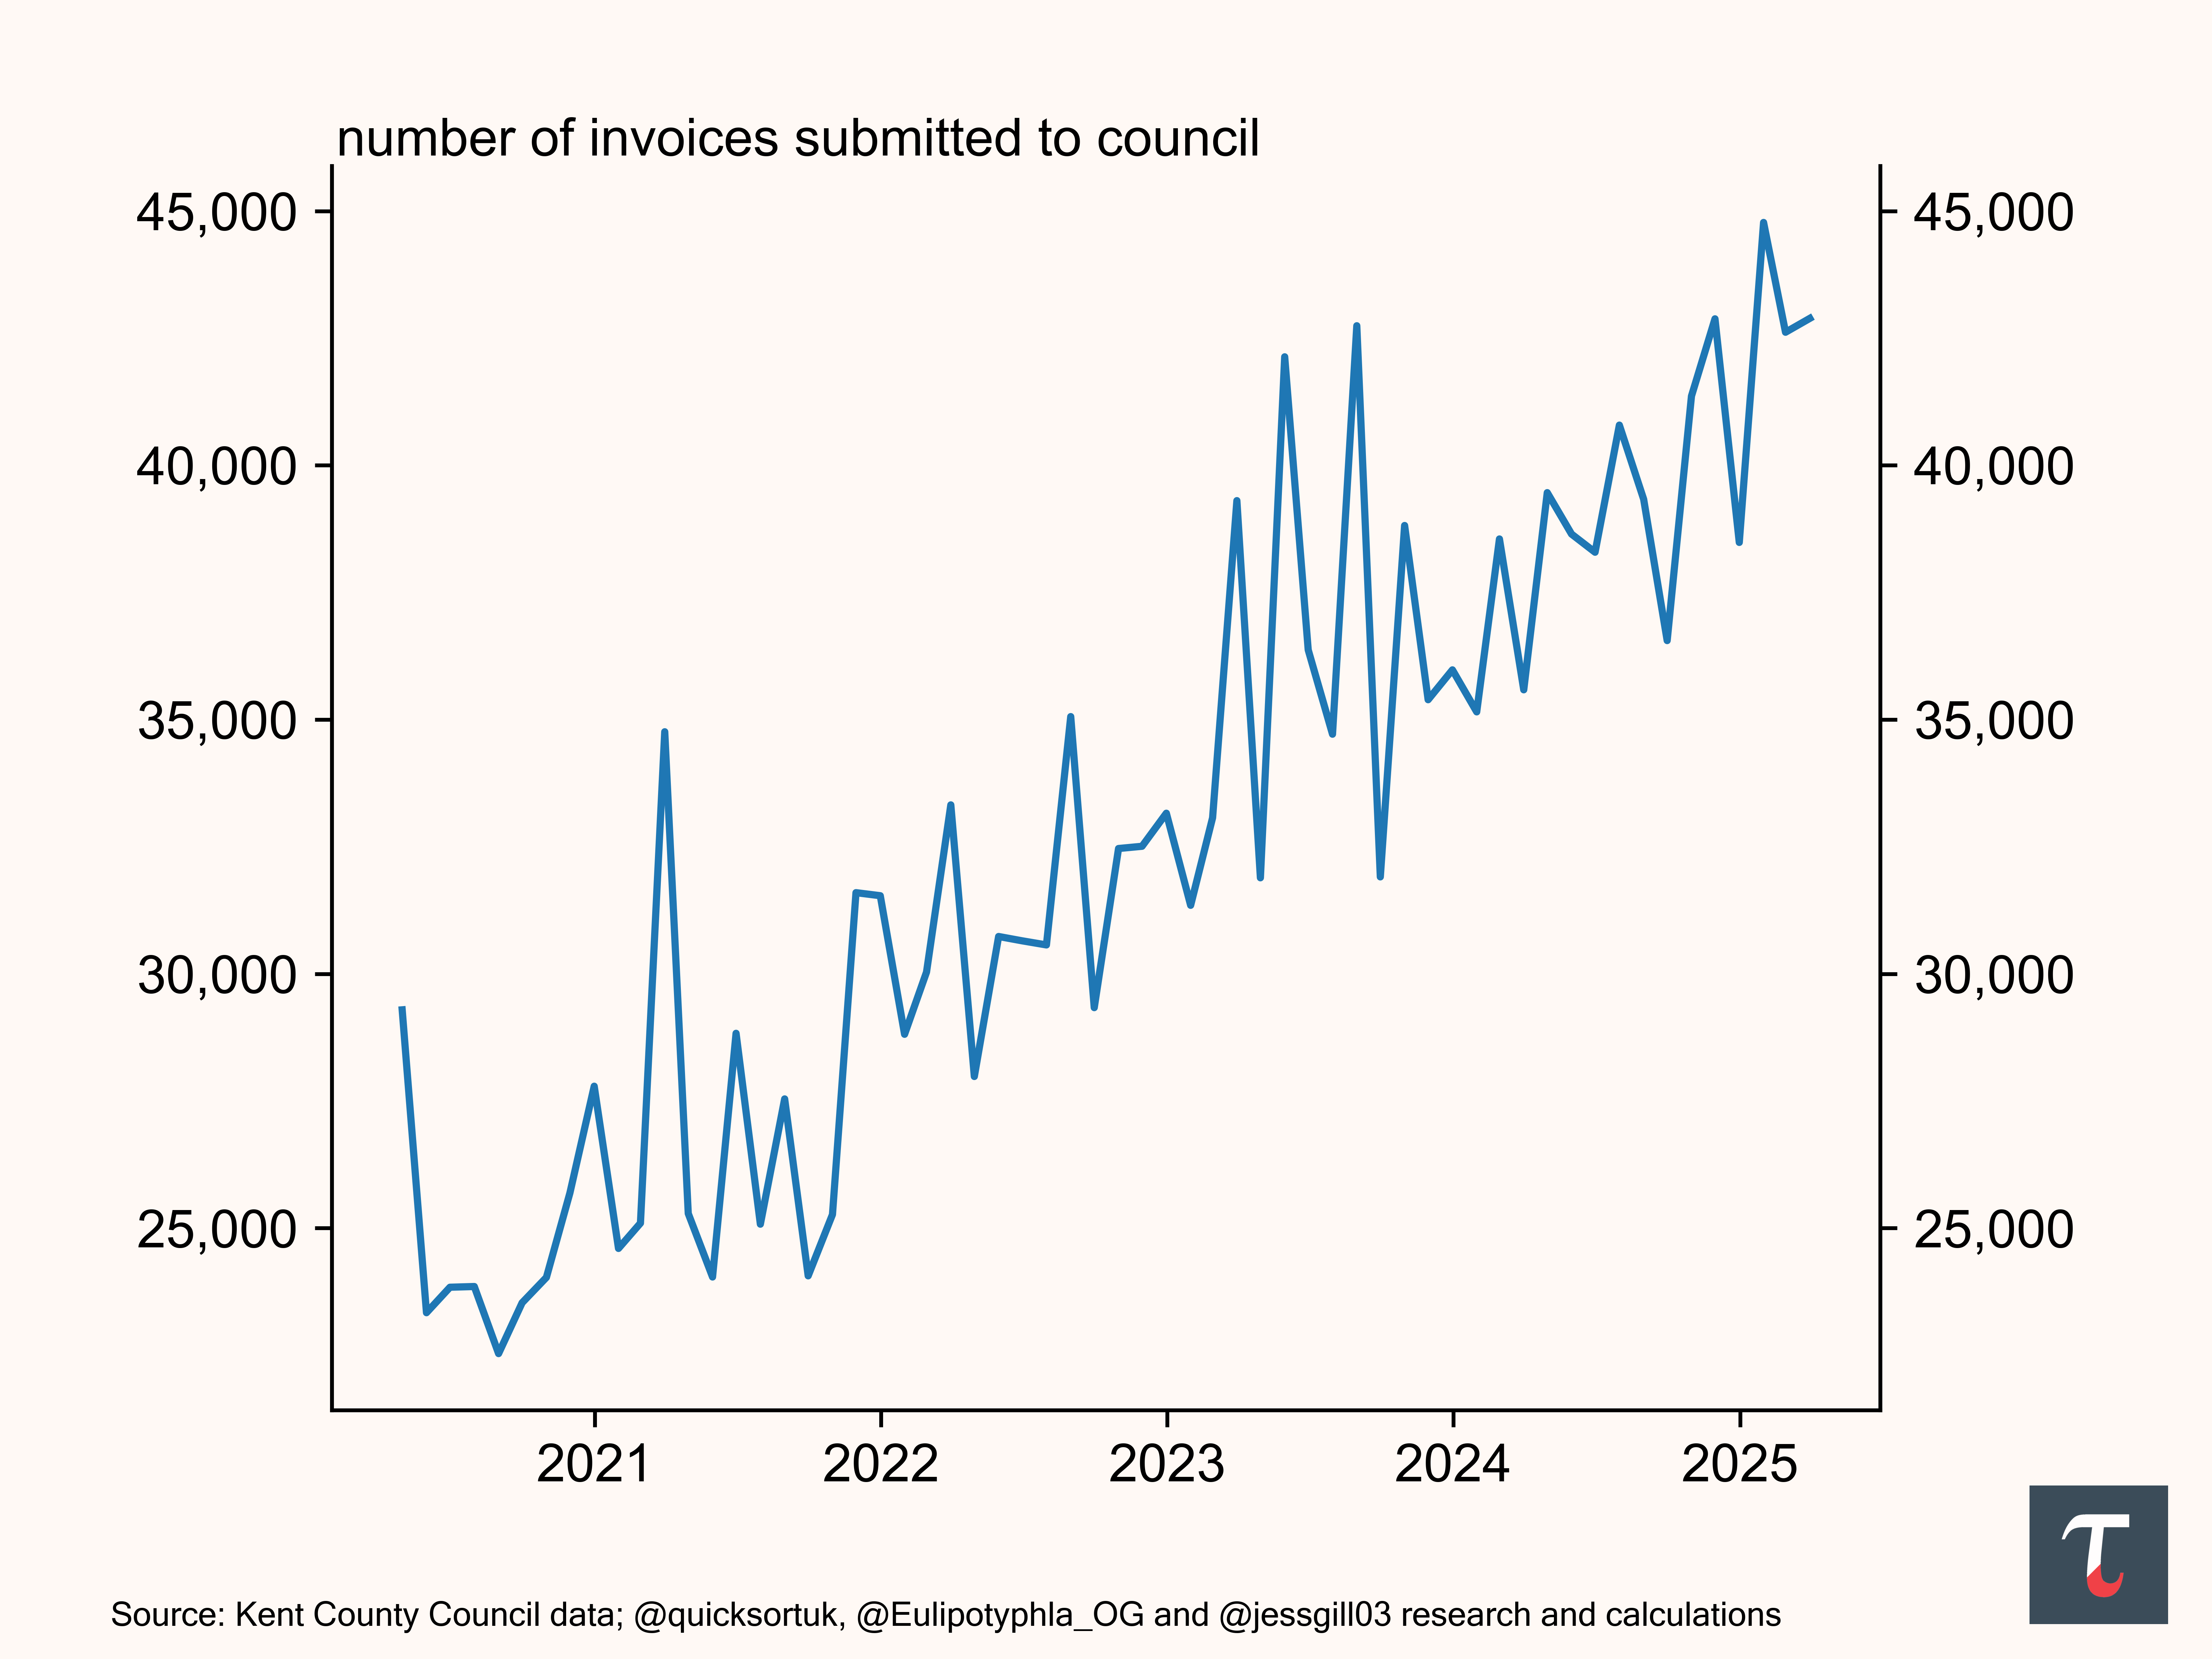
Exhibit 1 points to a public sector culture at ease with private firms feeding off taxpayer money — a problem that began before COVID, but has grown unchecked since. The number of monthly invoices above £250 in Kent has surged from 22,500 to around 44,000 — up 96% over five years.
Exhibit 2 shows Kent County Council’s monthly spend, rise from £100 million to £180 million, an 80% increase — three times higher than inflation (26.8%) over the same period.4
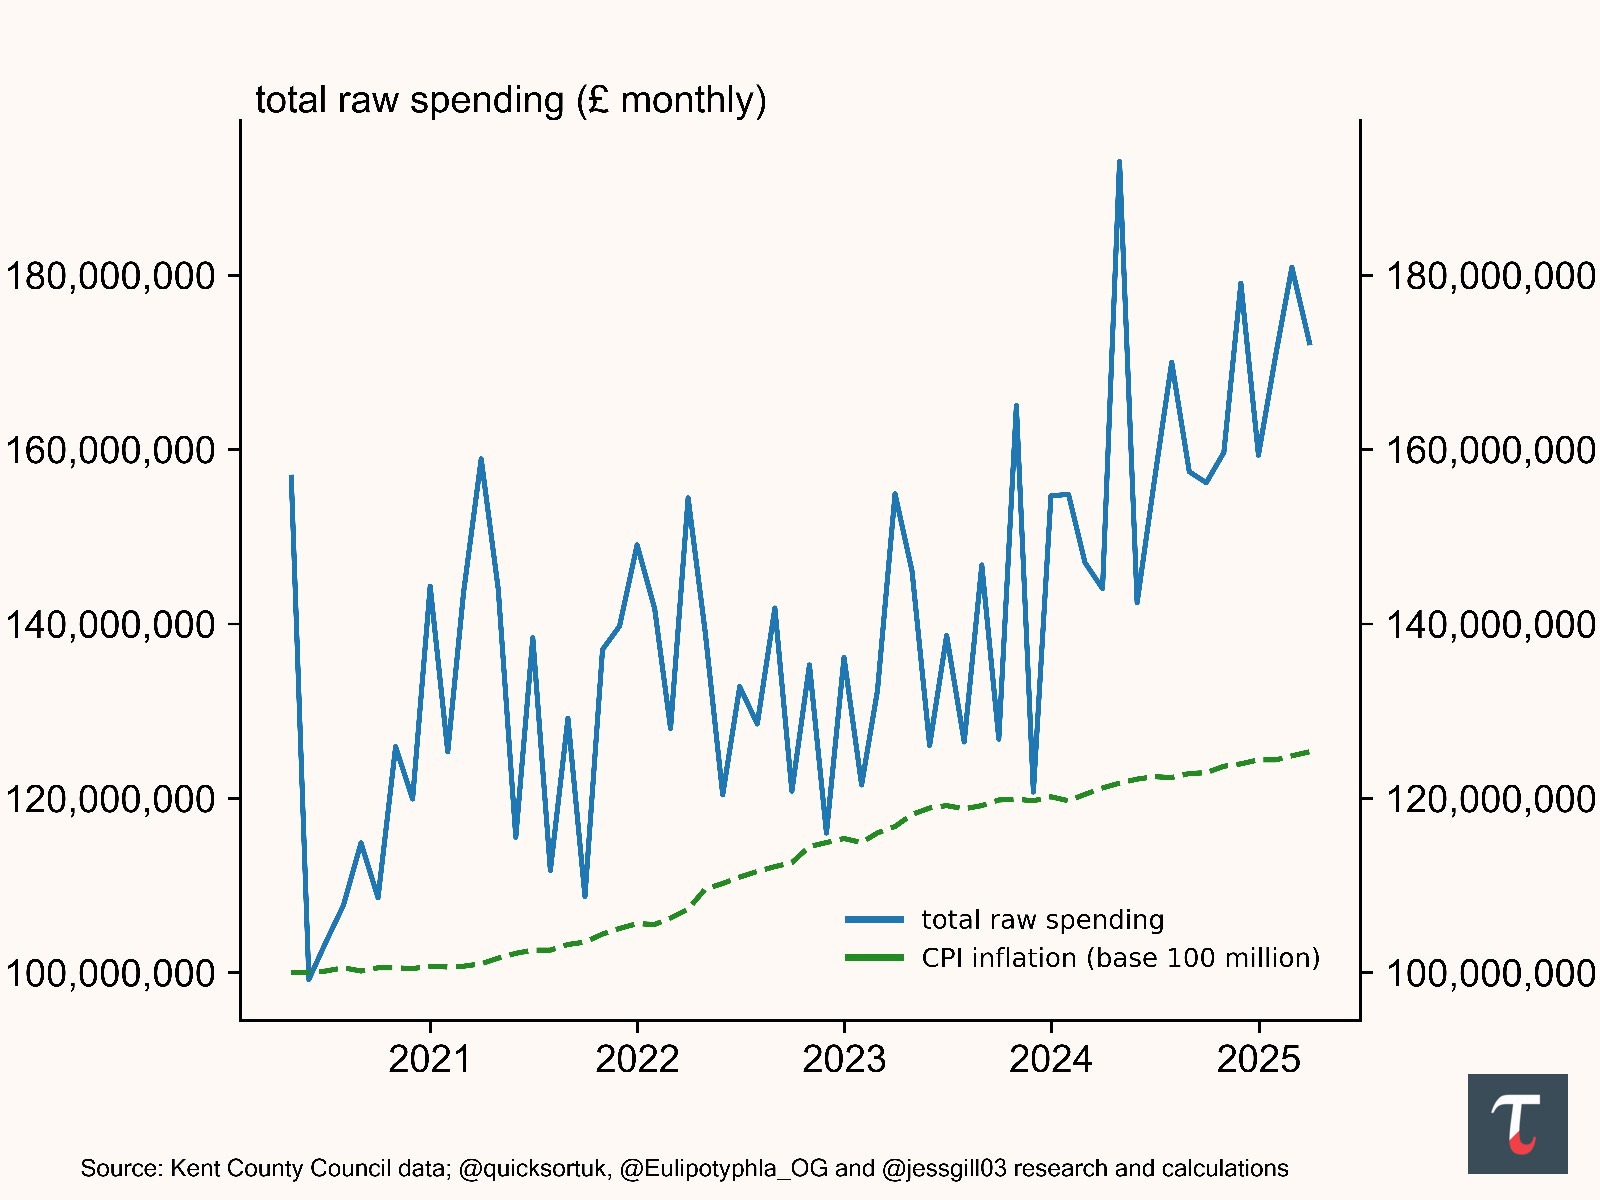
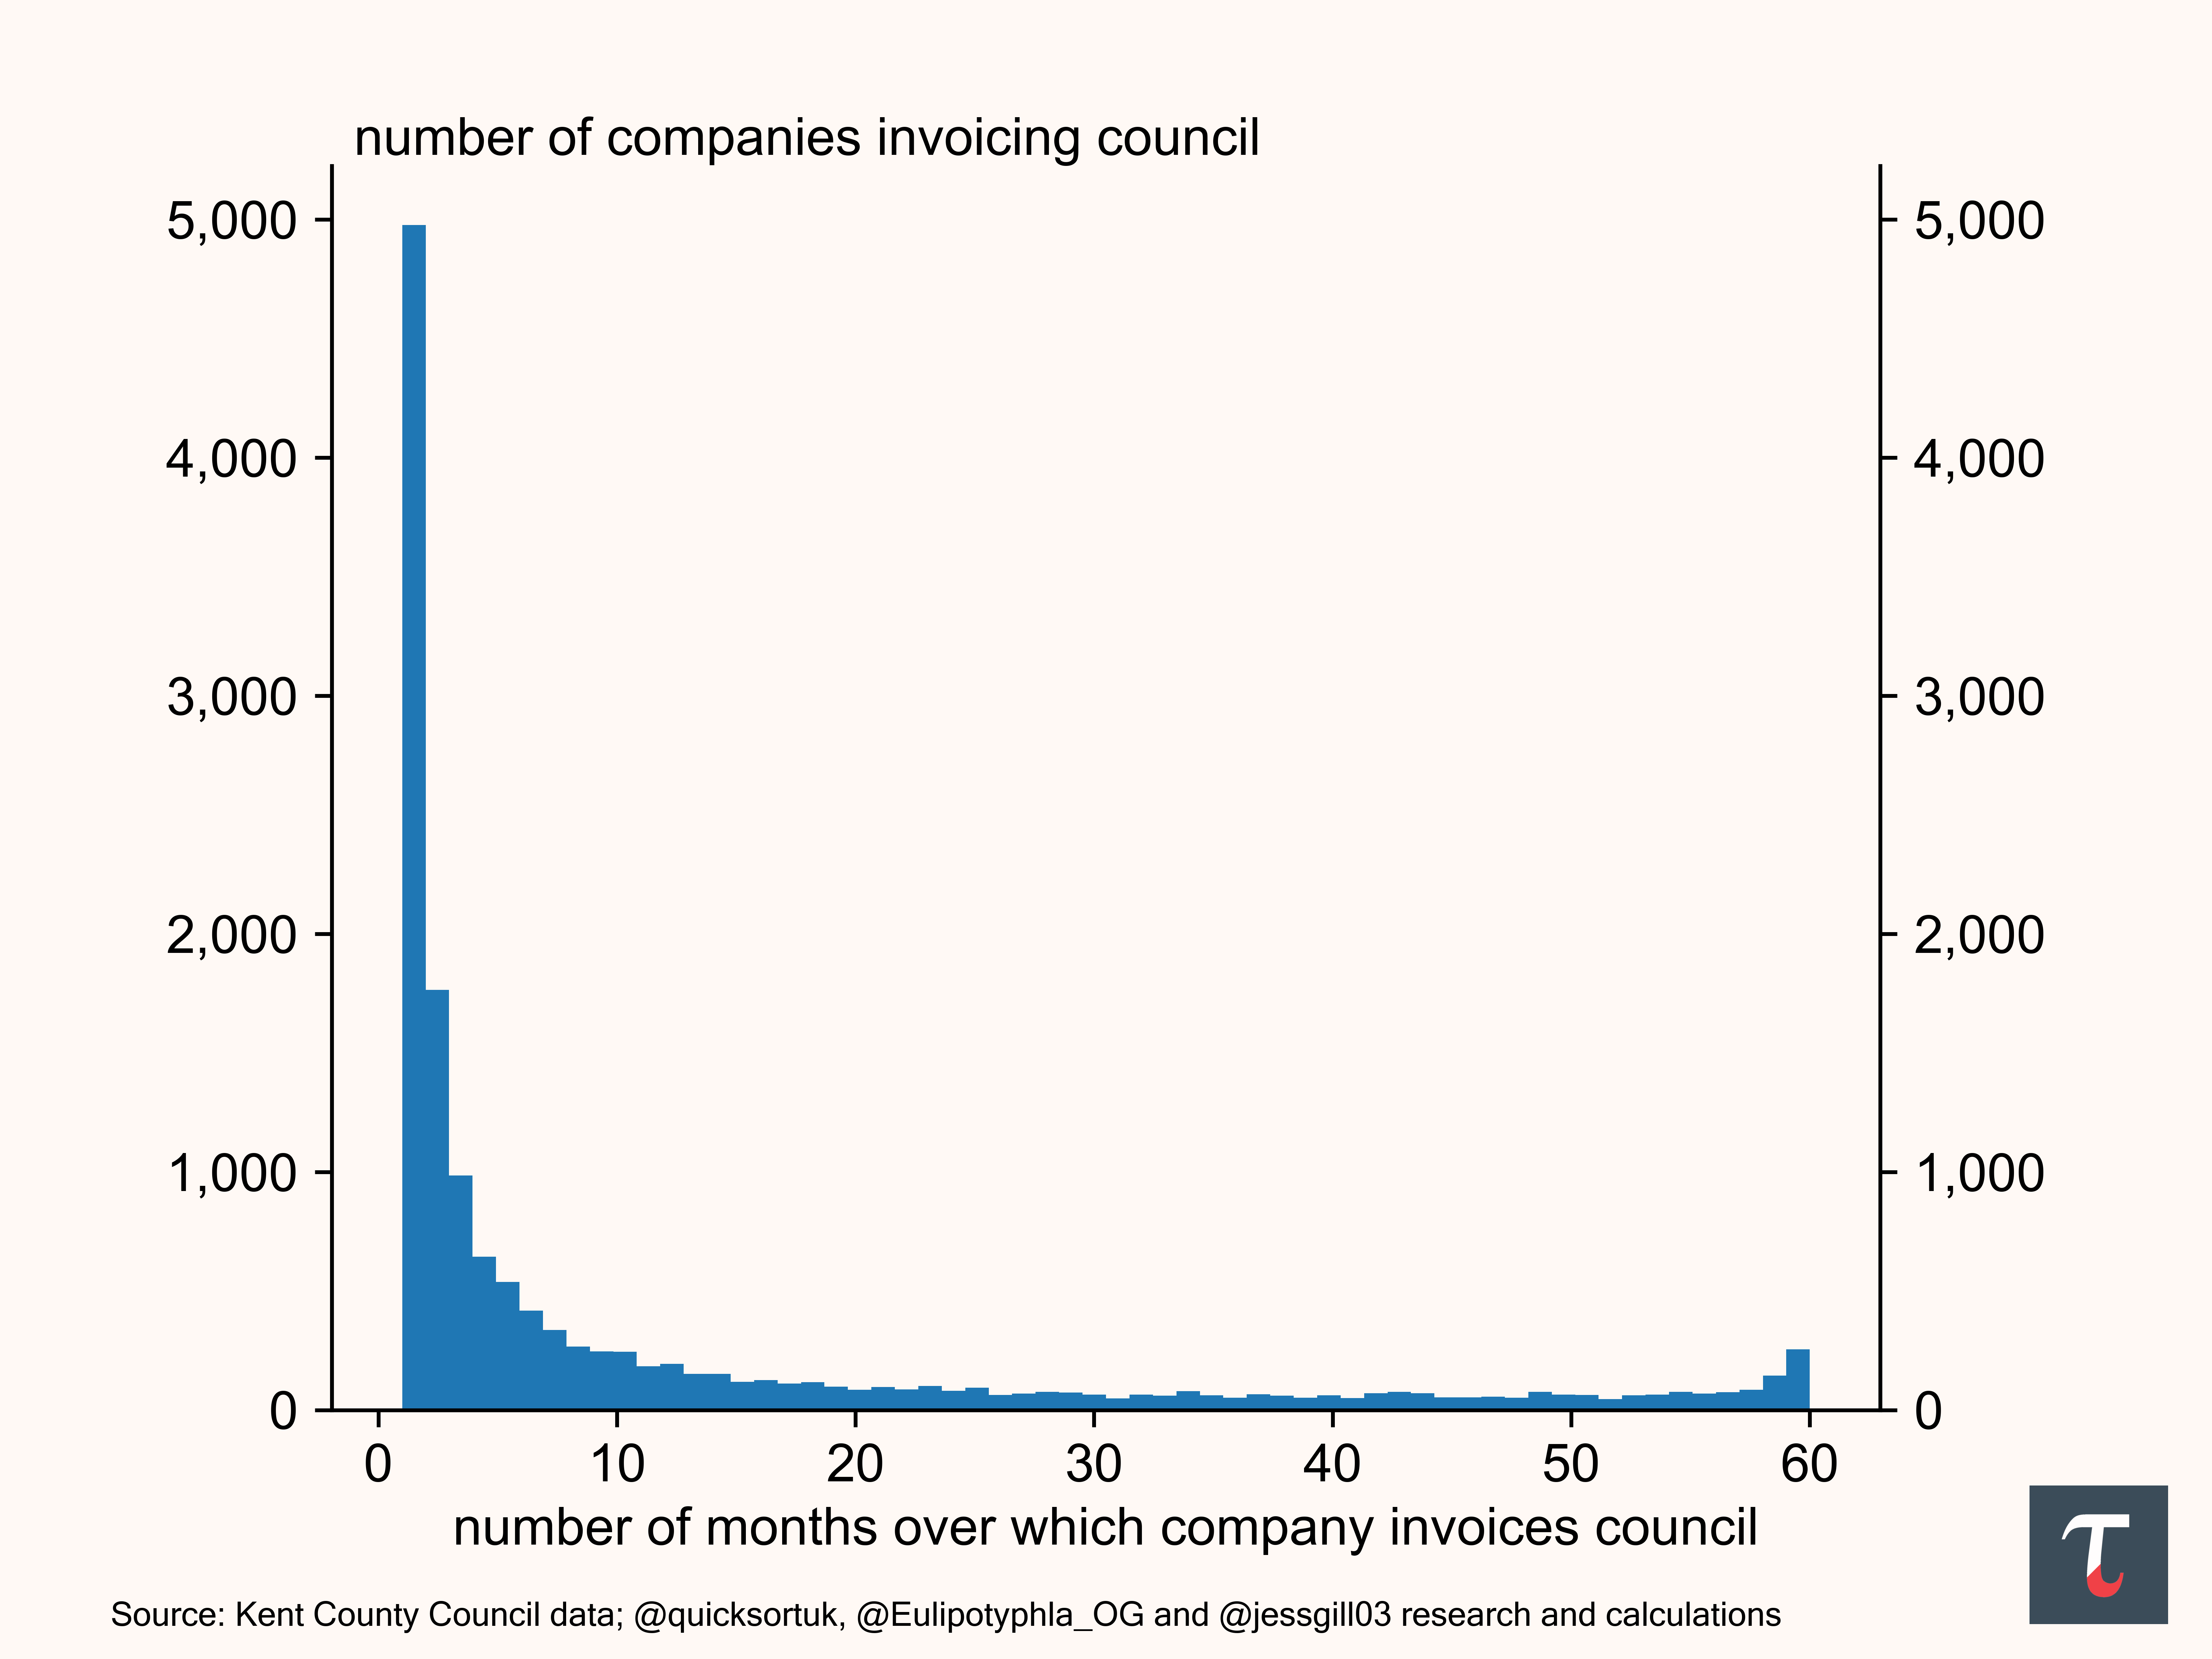
Exhibit 3 notes that over 14,700 companies have invoiced Kent Council across five years. With this scale of contracting, assessing value for money or controlling waste is nearly impossible. There is so much data and so many contractors that many Councillors and Council officers are simply left unsure where to begin looking.
Root Causes — Fraud, Statutory or Systemic?
Waste from statutory duties have attracted much public ire. Reports that Kent Council lost £2.4 million in 2024 to fraud and human error, also drew big headlines too.5 But the 96% rise in the number of receipts submitted tells the real story. At its core lies a deeper systemic issue: “Contractor-ism.”
An illustrative study of runaway spending
Let’s examine one of Kent’s 102 expenditure categories: Commissioned Services (Other), covering contractor work outside of the standard categories.
Monthly spending here rose from £40 million in 2021 to £80 million, growing 15% annually — three times the 4.8% inflation rate, see Exhibit 4. Monthly receipts also doubled from 14,000 to over 28,000 at their peak.
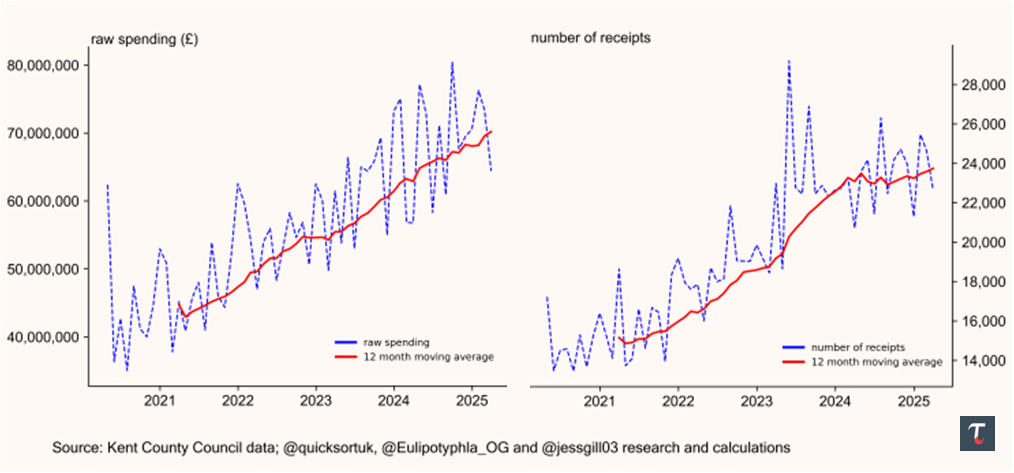
Our principal message: the surge in invoices submitted to the ‘money tree’ of local government, is the primary factor for this rise in spending, with inflation being secondary, see Exhibit 5.
To identify areas where spending increases have been primarily driven by volume, we analyse every category of Kent Council spending, presented in Appendix A, B and C. For each category, we plot the monthly spend, the number of receipts, and perform a weighted least-squares regression.
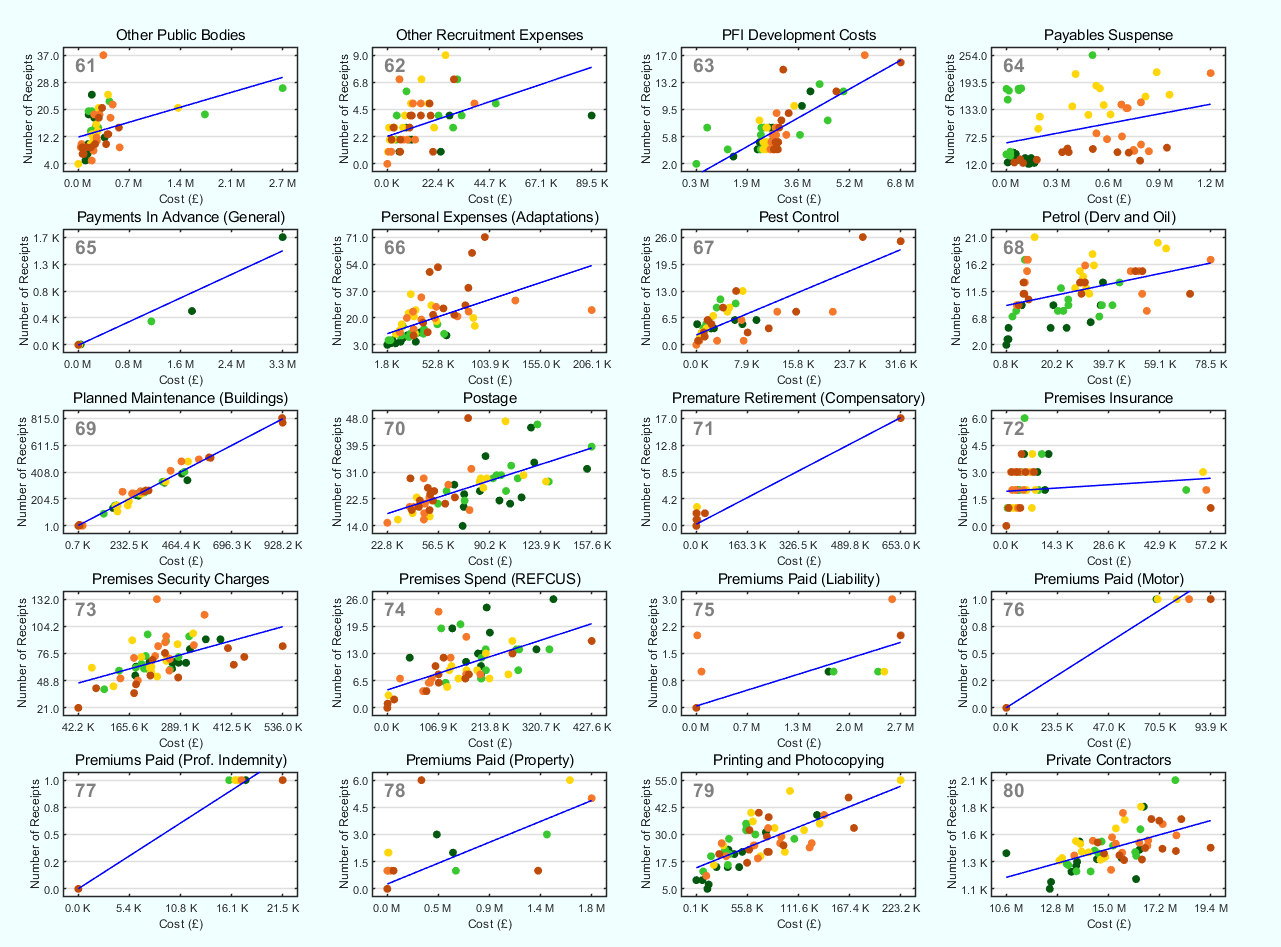
Categories with similar runaway spending, include: Agency/ Contracted Services (C-3), Expenditure — Buildings (C-4), Contract Catering (C-25), Contract — Hire / Operating Leases (C-27), Early Years Education (C-32), Electricity (C-33), Grants (C-44), Home to School Transport - Hired (C-47), KASS (C-52), Legal Fees (C-55), PFI Development Costs (C-63), Payables Suspense (C-64), Personal Adaptations (C-66), Pest Control (C-67), Petrol (C-68), Printing (C-79), Private Contractors (C-80), Public Transport — Clients (C-85), Services (C-93), Social Services (C-94), Specialists (C-96). See Exhibit 6 below, and the Appendices, for more details for each category.
Action Points — What are the next steps?
Following our Trafalgar Analytics paper on School Taxis in Kent, where home-to-school transport costs doubled over four years, it is vital that councillors explain the rise to voters and propose how these costs could come down.
This paper seeks to achieve the same ends; Kent offers plenty of low-hanging fruit for Reform UK.
Elected officials must address the root cause of this explosion in spending, explaining:
1. Which categories of spending has increased above inflation, and why?
2. What they seek to do, to reduce spending - for each category?
3. What new and more accountable procurement processes will be rolled out?
4. What national legislation needs amending or repealing - to curb wasteful statutory spending?
A culture of risk avoidance and austerity has hampered councils from delivering services in-house, leaving contractors unchecked. While there is no silver bullet for local government efficiency, this paper offers a starting point for how councils, like Kent, can tackle out of control spending.
If you enjoyed this paper, feel free to like and share. For more insights on DOGE-UK topics, follow Charlotte Gill (@WokeWaste), and for all other subjects, follow Trafalgar Analytics on Twitter and Substack.
By Charlotte Gill (@WokeWaste), Eulipotyphla, Jess Gill, and Quicksort
Trafalgar Analytics, 12th June 2025.
At Trafalgar Analytics, we are building the leading Data Analytics and Research Centre on the British Right.
Our work sits at the intersection between data science, economics, and political science. We believe in a data driven approach for tackling the foremost societal, economic, and political challenges of our time.
If you are interested in supporting, collaborating, or working with us, do not hesitate to get in touch. For general inquiries: info@trafalgaranalytics.co.uk; for secure contact: trafalgaranalytics@protonmail.com (end-to-end encrypted)
Data Appendix - Overview
The Data Appendix, comprises of three sections: Appendix A focusses on spending, Appendix B focusses on receipts submitted, and Appendix C assesses the spread and conducts a weighted least-squares regression across all categories of spending.
(Note: Kent data before 2020 is missing, which is not the case with other councils, perhaps this is pandemic-related; this does warrant further investigation — why?)
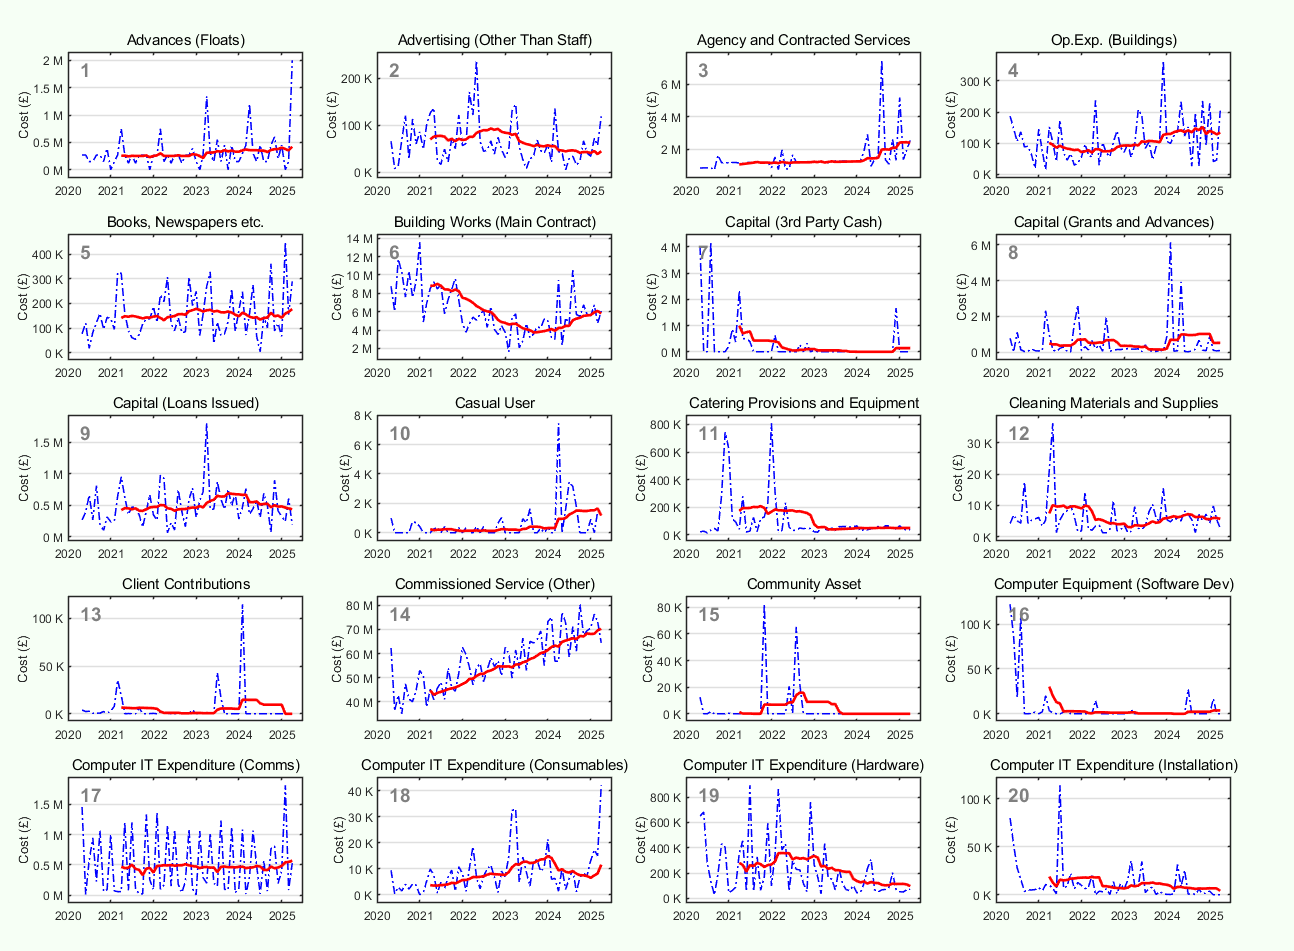
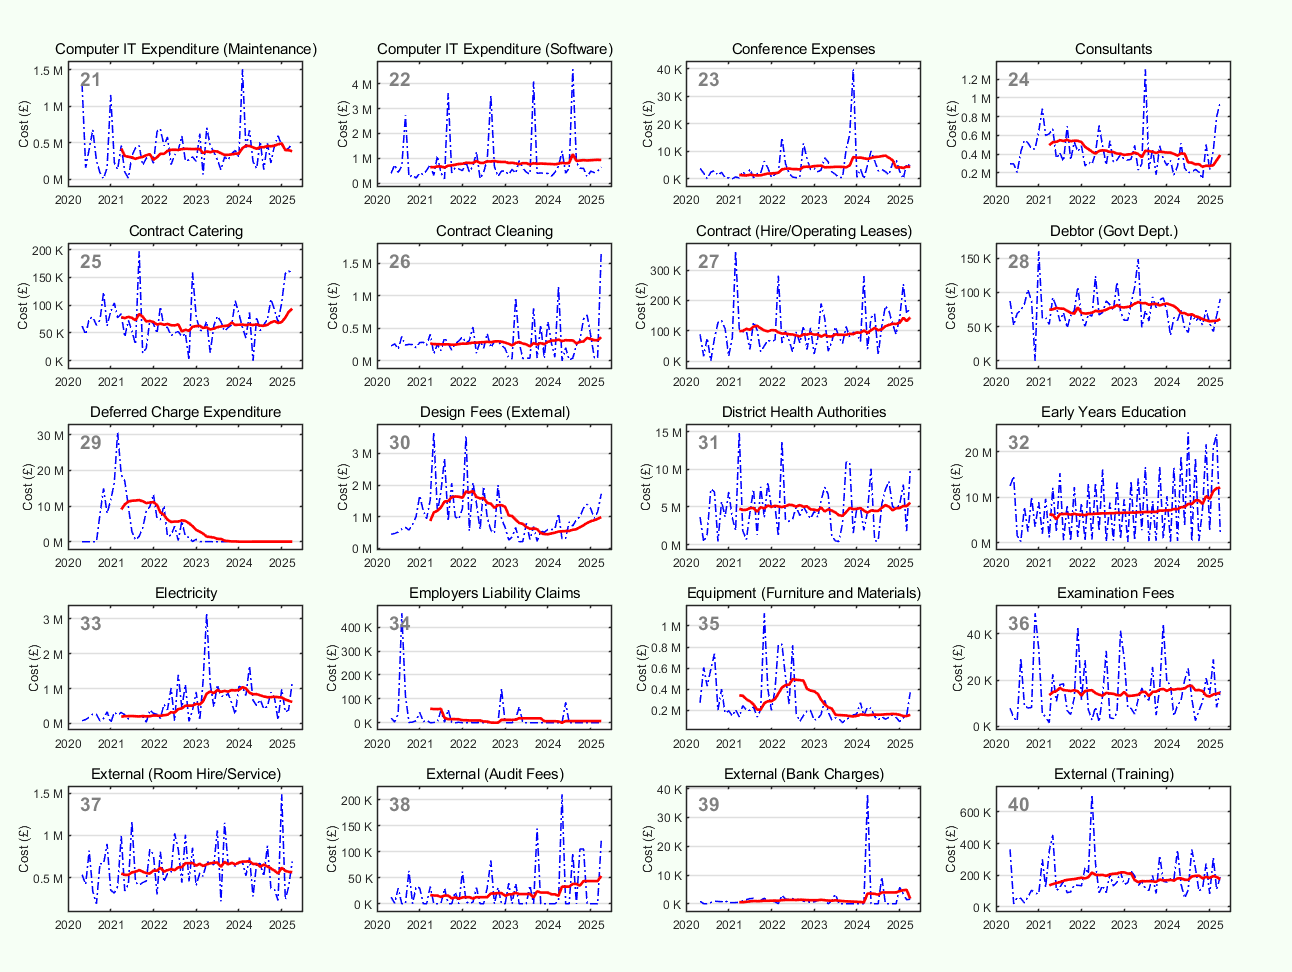
Appendix A — Kent County Council Spending
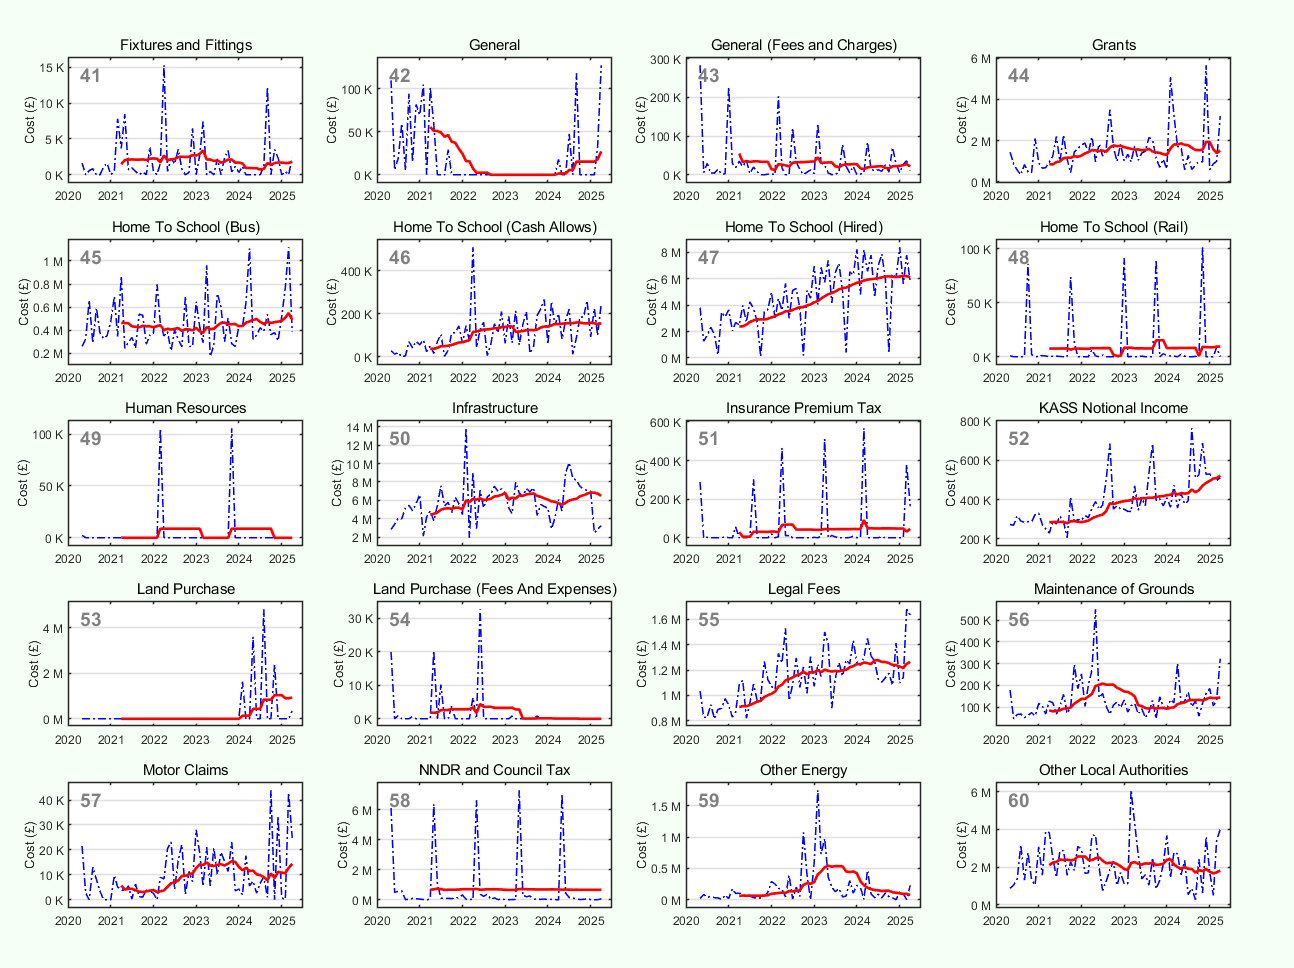
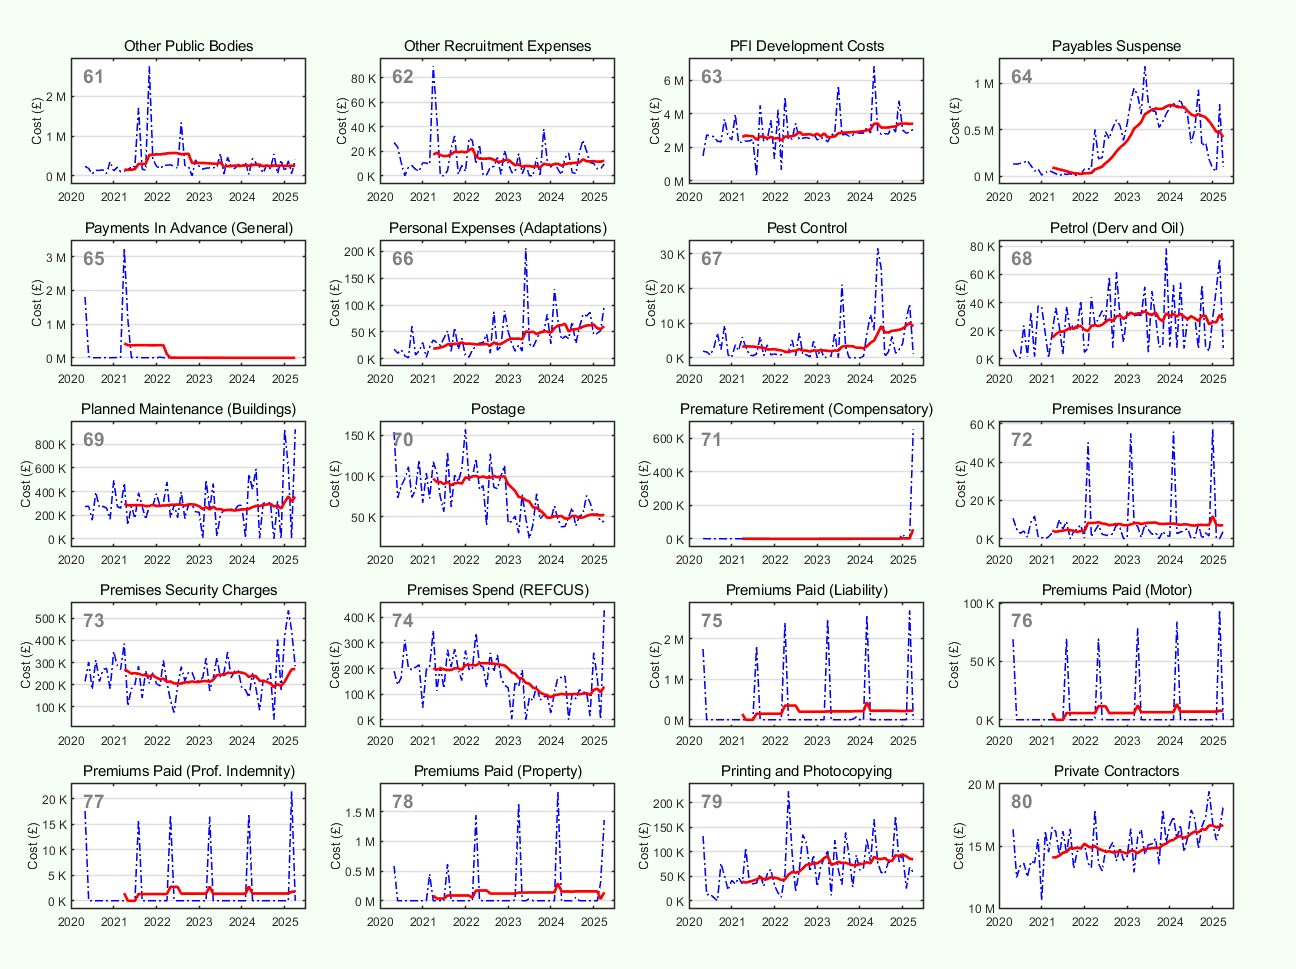
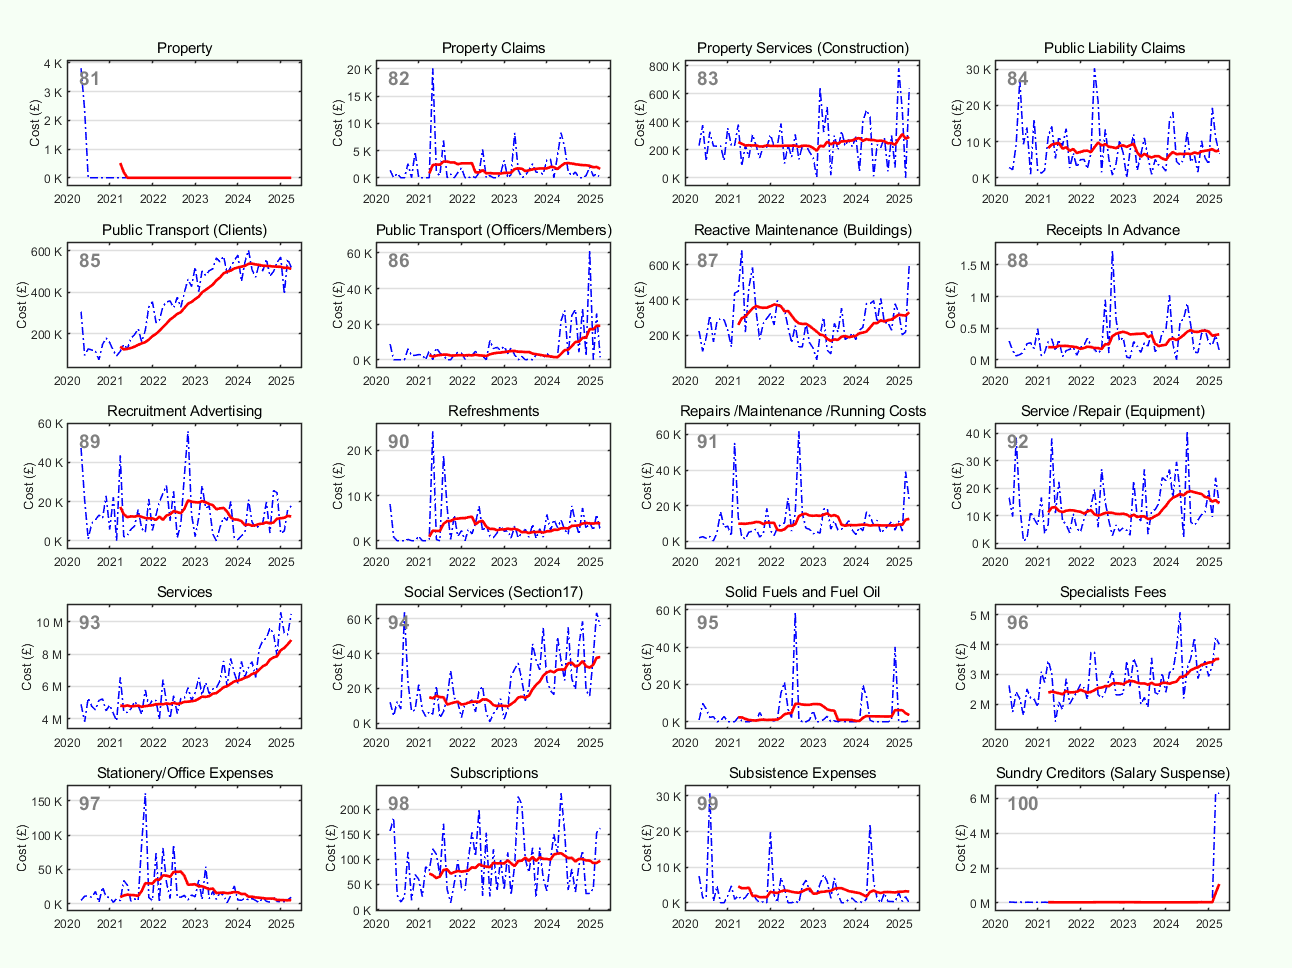
We review Kent County Council’s monthly outgoings (all items over £250) for the past five financial years, covering 102 categories of spending across this period. In Appendix A, we assess spending across time, looking at each category of spending, at a granular level, and aggregate this based on the council’s own categories.
Each category is plotted below (blue). Alongside this, we plot a moving average over a 12-month window (red) to assess general trends and direction of travel. Each graph is labelled, for ease to compare and contrast across the appendices.
Focus #1: Home-to-School Transport (HST) - Graphs 45 to 48 provide a more detailed breakdown of the modes of HST. This analysis expands on the Trafalgar Analytics Paper on Kent (May 2025), which covered the doubling of costs — from £4 million to £8 million per month getting children to school, over the past four years. The scale of this was highlighted by Cllr Kemkaran, the Leader of Kent County Council in the Telegraph’s DailyT podcast (05-June 2025) to the shock of the hosts — Camilla Tominey and Gordan Rayner.
Focus #2: Commissioned Services — as discussed earlier in this paper, the jump from £40 million to £70 million over the last four years (Graph 14), needs a major review.
Focus #3: Early Years Education — This budget has doubled in four years (Graph 32), and it is not entirely clear that Kent has doubled in the number of toddlers over this time.
Focus #4: Printing and Photocopying — Though a small item under the radar, printing costs has doubled in four years. Is it more waste or has Council Officers doubled their workload?
With so much data, this serves a starting point to assess Kent’s spending. In each category, there are many thousands of rows of spending, which will require care to sift through.

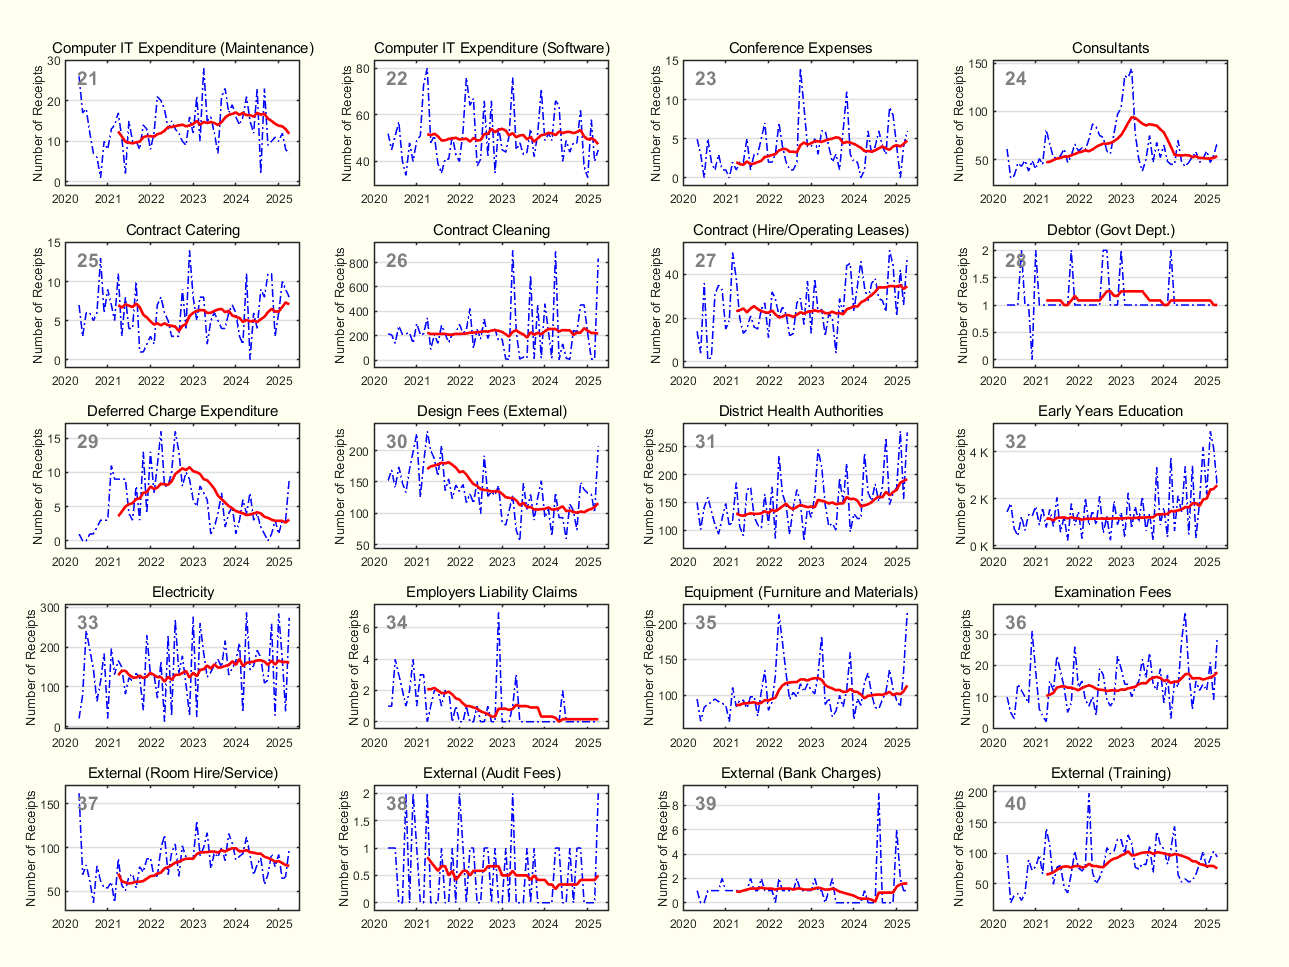
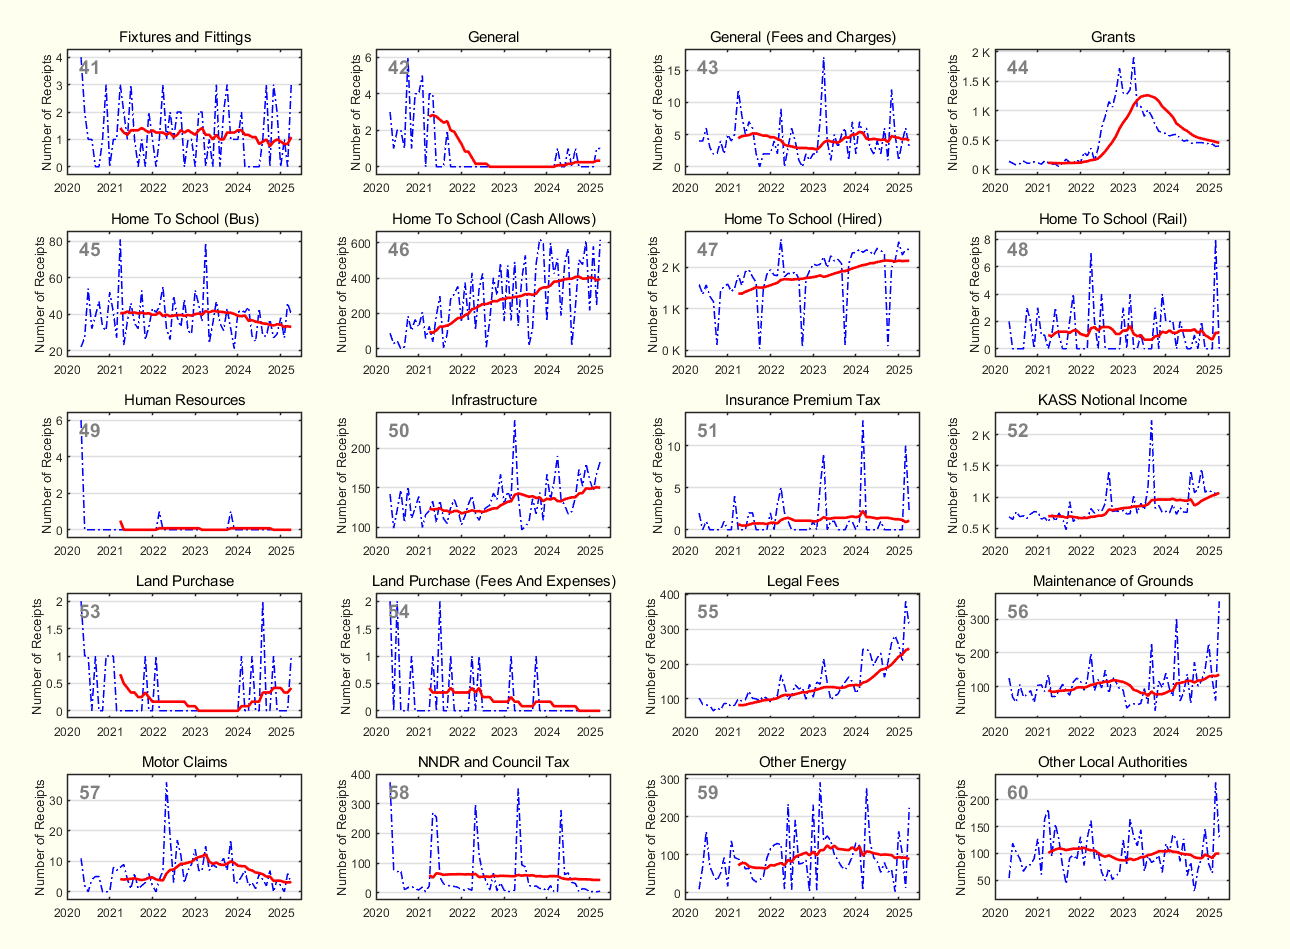
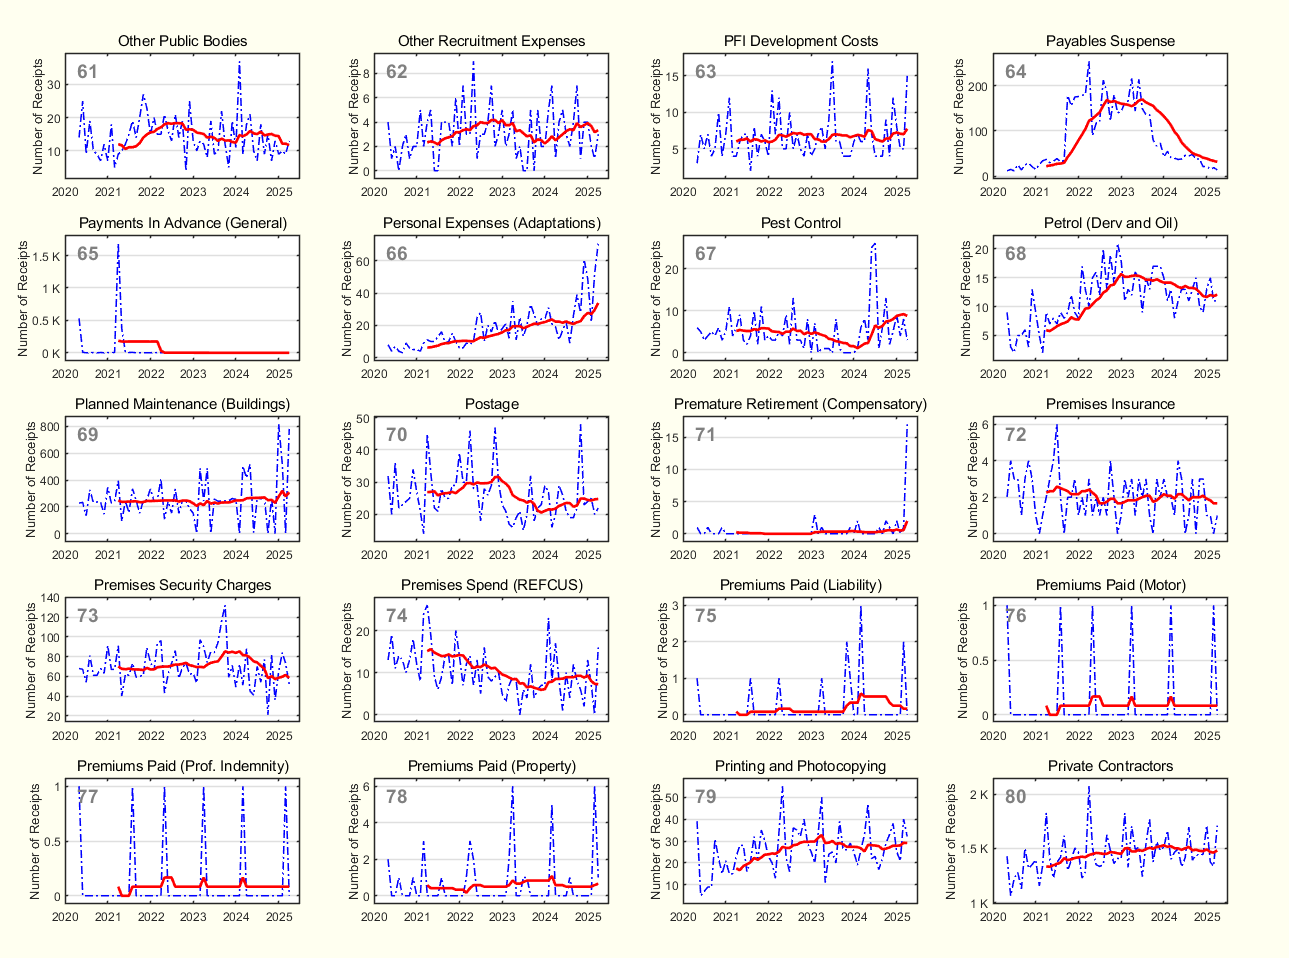
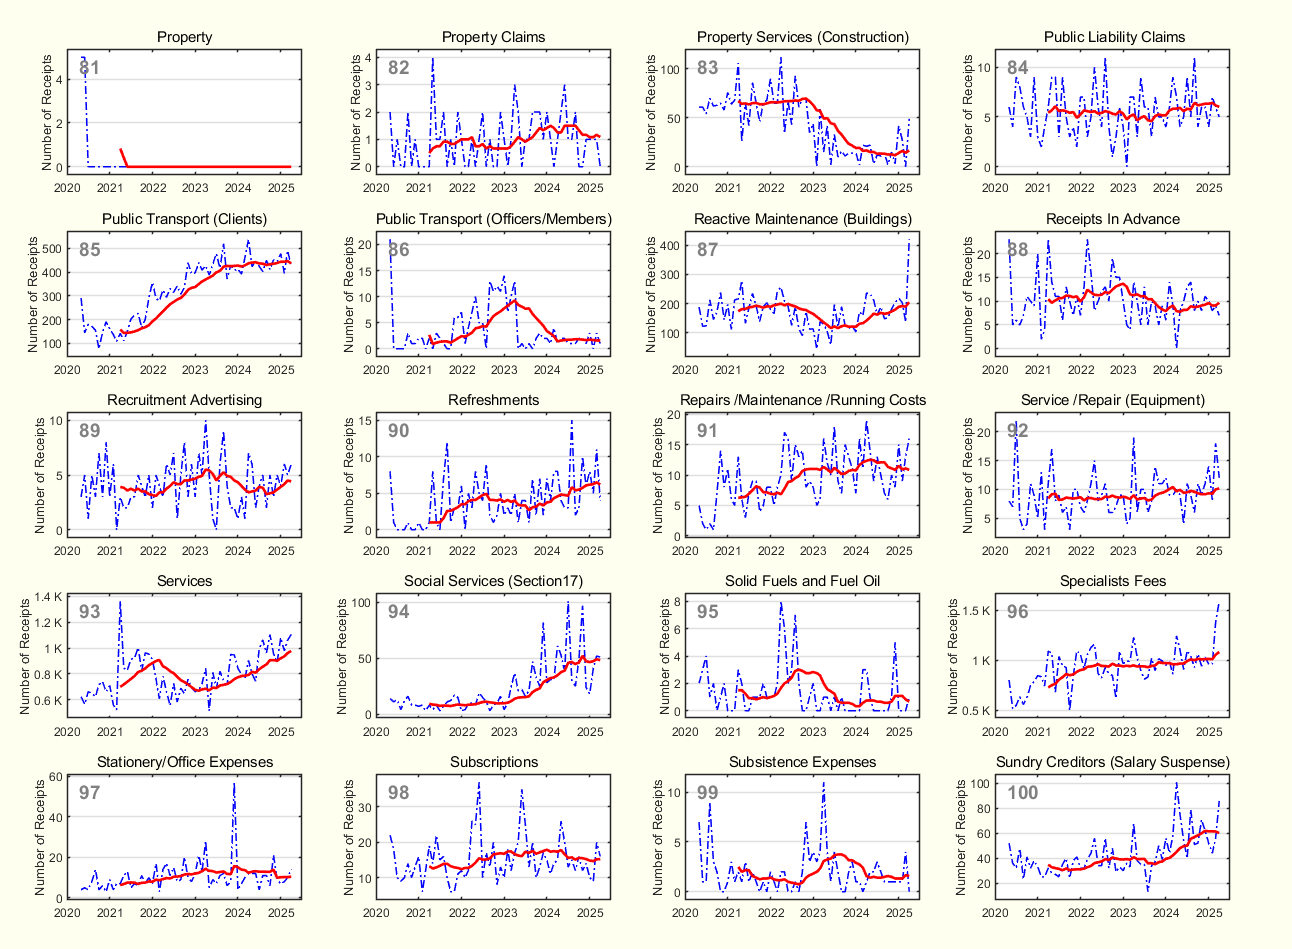
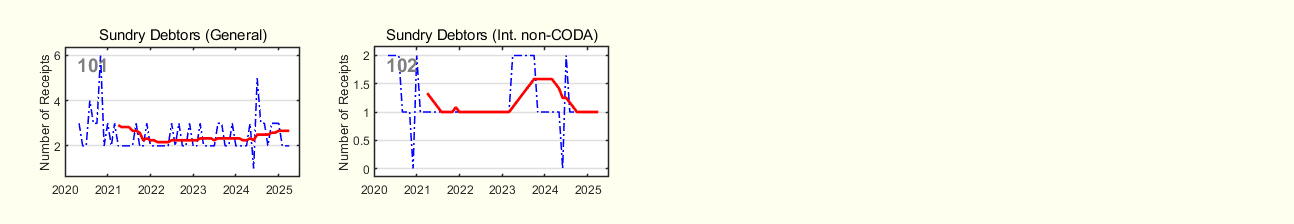
Appendix B — Kent County Council Receipts
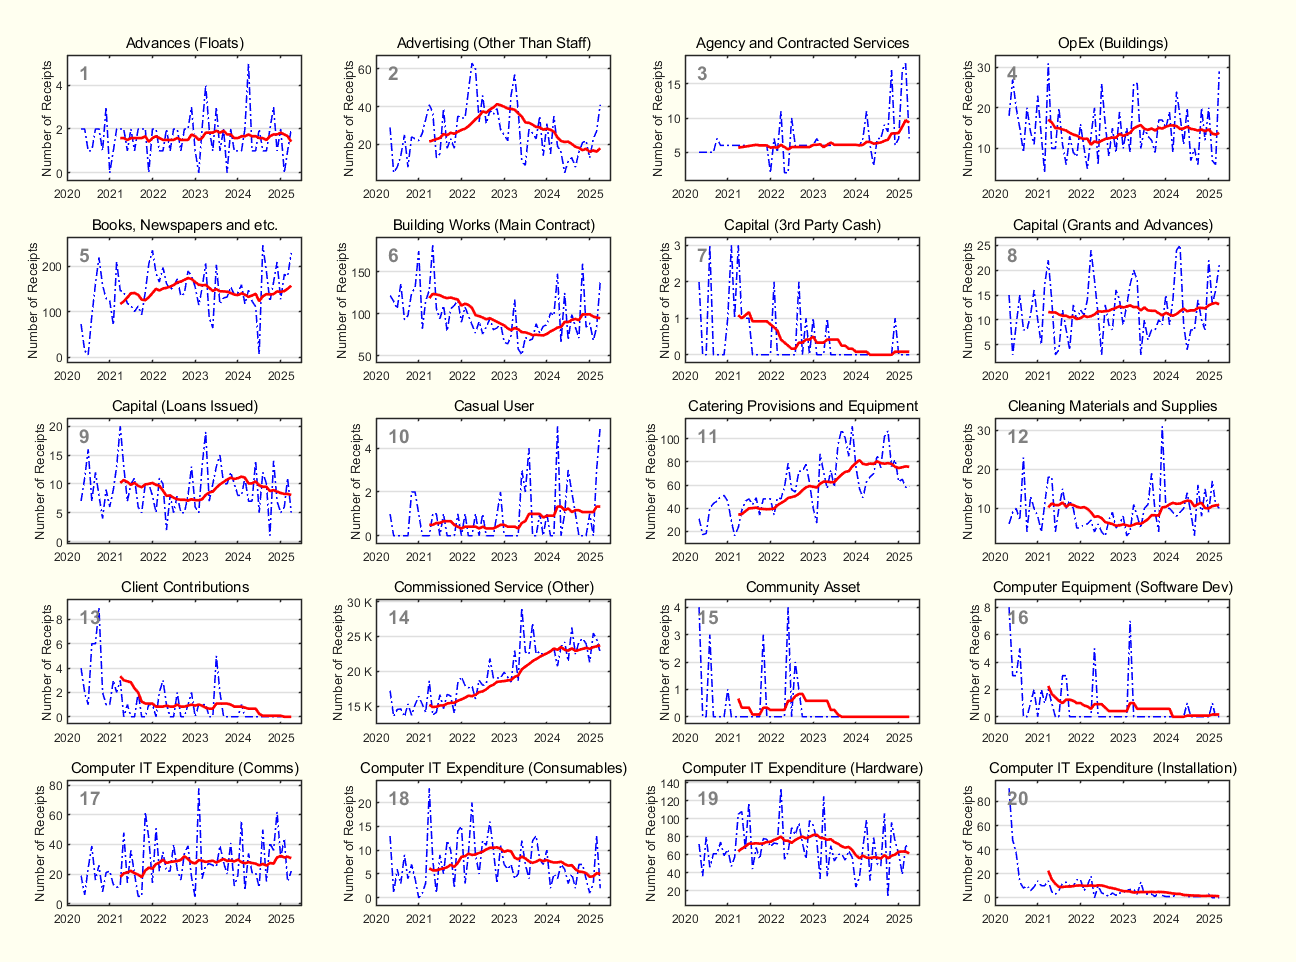
Appendix B examines the number of receipts (over £250) paid by Kent County Council over time. We analyze monthly outgoings across five financial years, covering 102 spending categories. Receipts are aggregated and plotted based on the council’s own classifications.
By tracking receipts over time, we determine whether costs rise due to higher contractor charges / inflationary costs, an increase in receipt volume, or both.
Each category is plotted below (blue). Alongside this, we plot a moving average over a 12-month window (red) to assess general trends and direction of travel. Graphs are labeled for easy comparison across appendices.
Focus #1: Home-to-School Transport (HST) — Graphs 45–48 detail HST modes, building on Trafalgar Analytics’ May 2025 policy note, which highlighted costs doubling from £4 million to £8 million monthly over four years. Receipts for hired transport (e.g., taxis) rose 60% in this period.
Focus #2: Agency and Contracted Services — Graph 3 shows a 66% increase in receipts over four years, signaling significant growth.
Focus #3: Commissioned Services (Other) — As noted earlier, Graph 14 reveals a major jump in receipts over the past four years, warranting urgent review.
Focus #4: Legal Fees — Graph 55 shows legal fee receipts surging from an average of 82 to 245 per month over four years, suggesting an area for further scrutiny.
With 14,700 companies submitting numerous receipts, extensive further analysis is needed to fully understand this spending.
There are several thousand regular contractors with Kent Council, who have submitted receipts for 12 to 60 months. Whilst logic might suggest that the biggest contractors should be the main focus for further investigation, it would be unwise to ignore the many smaller contractors, who have contracts running to hundreds of thousands of pounds.
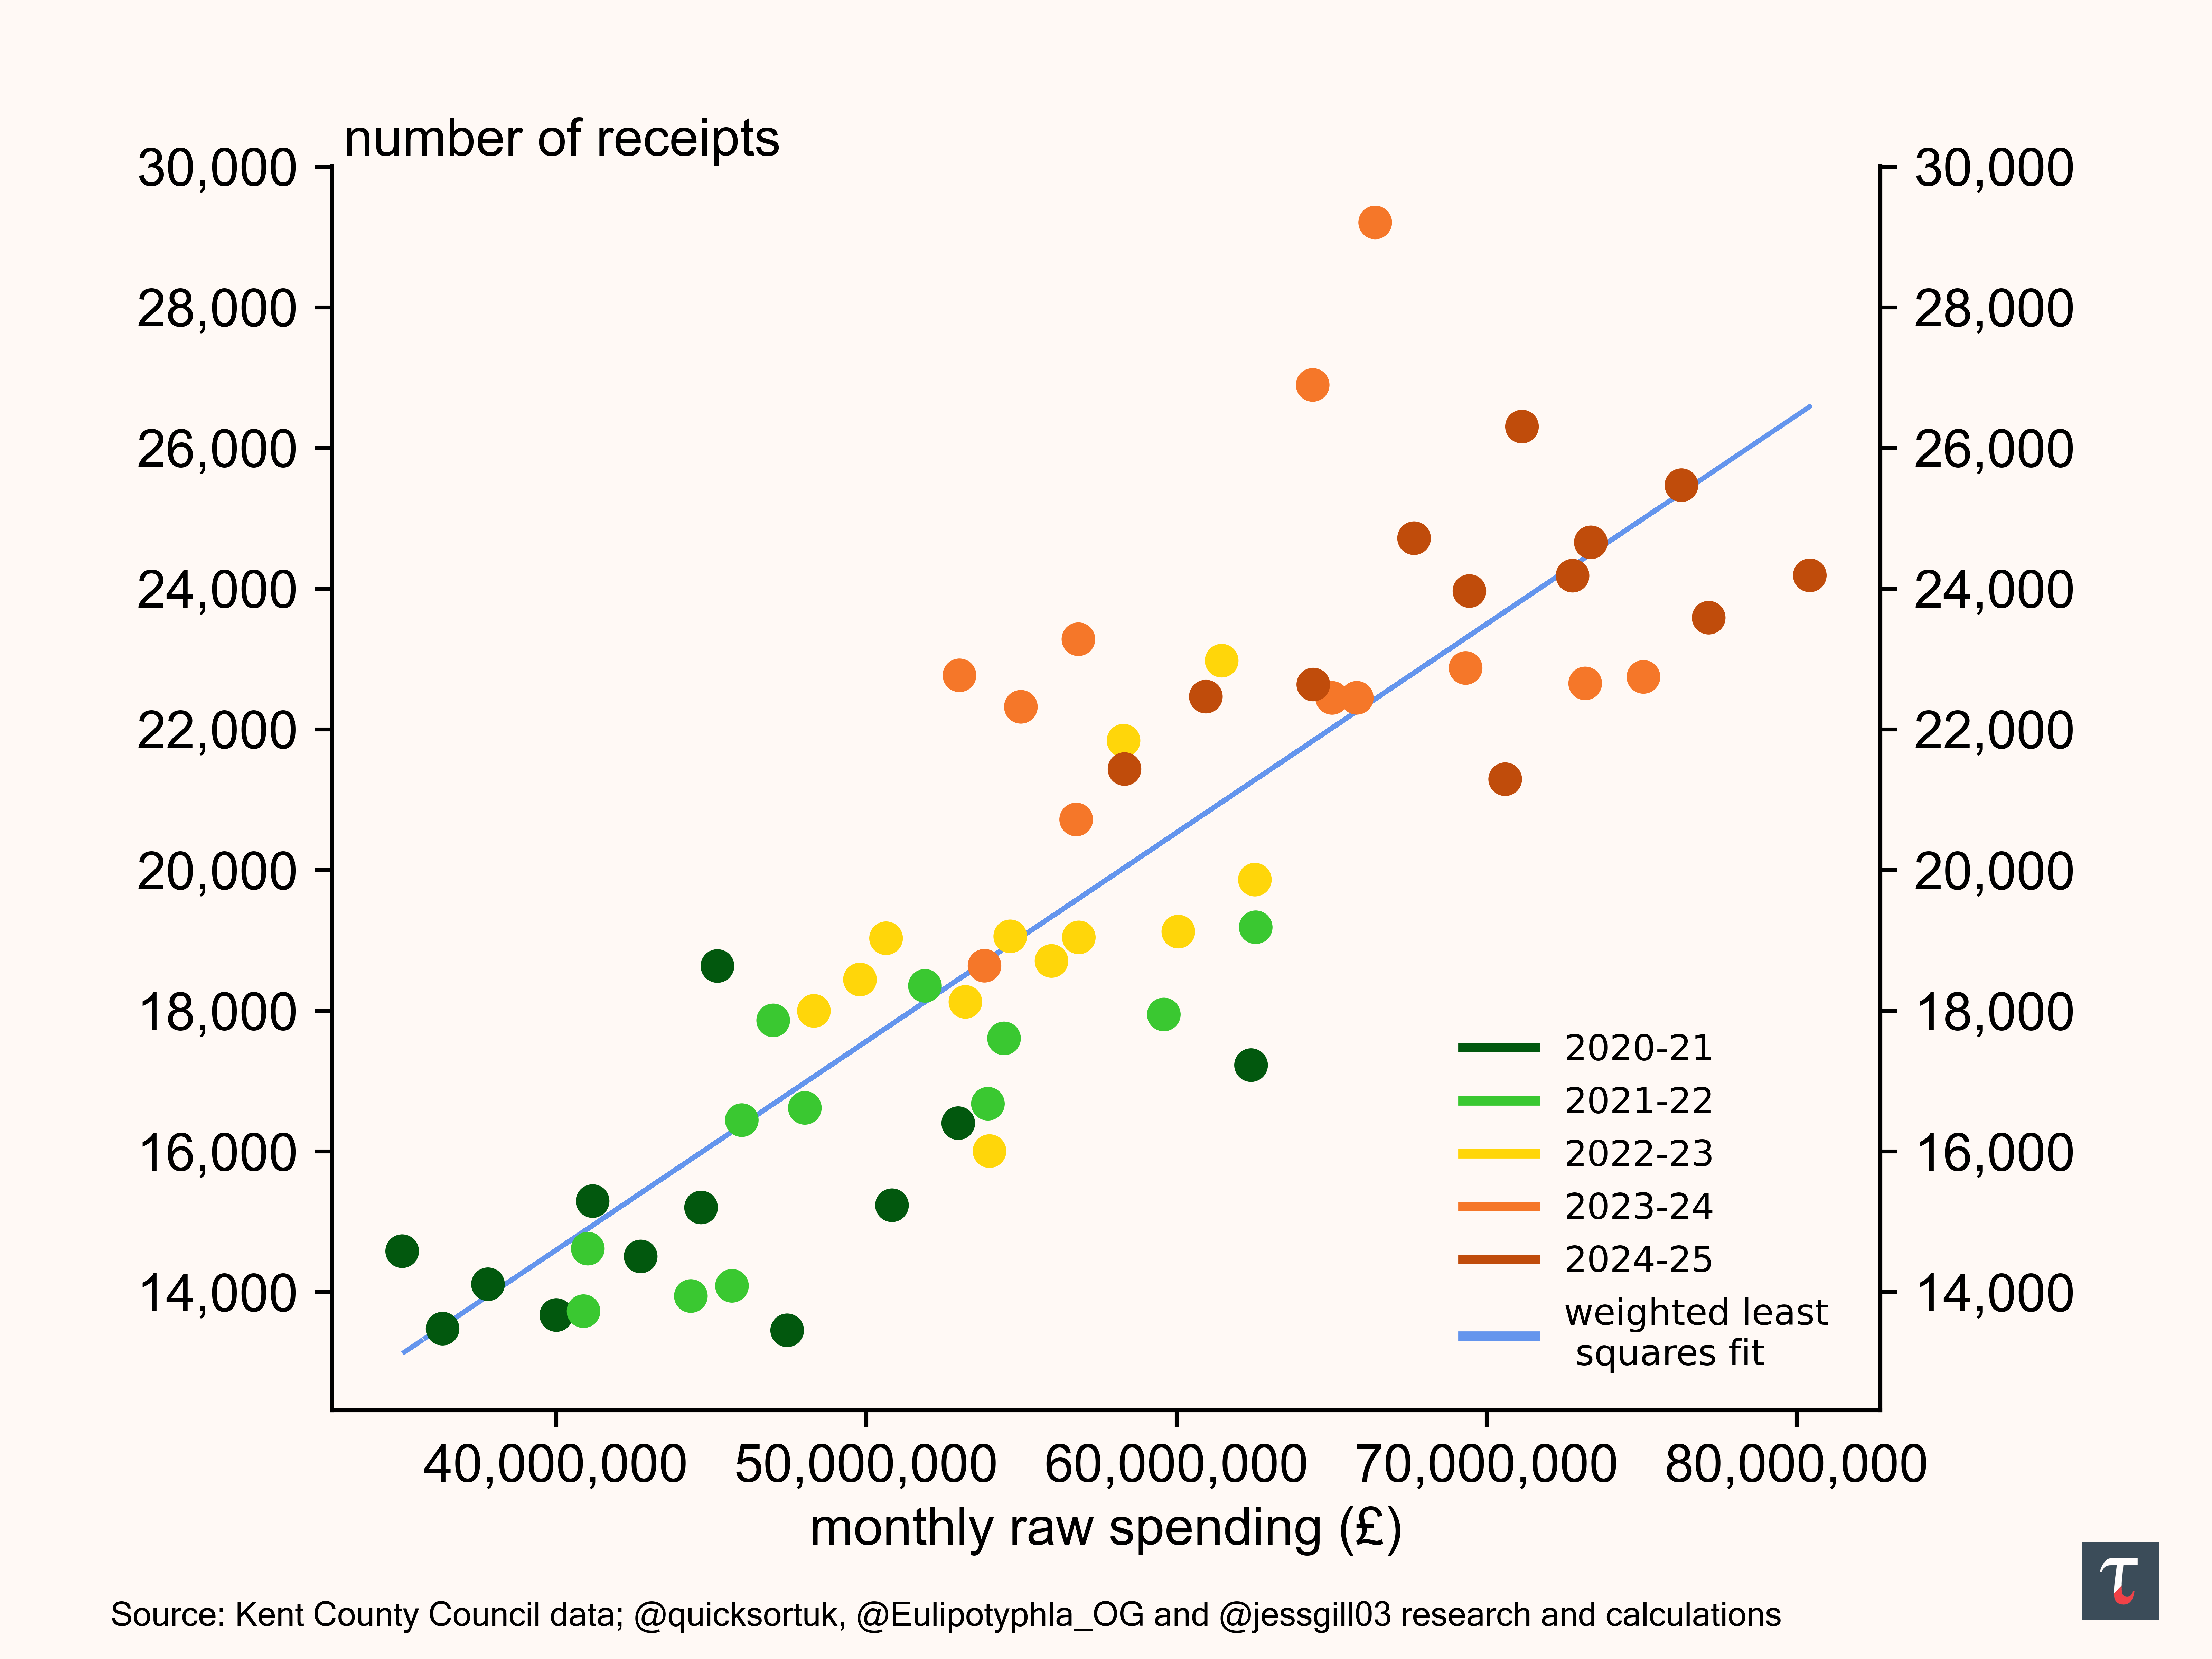
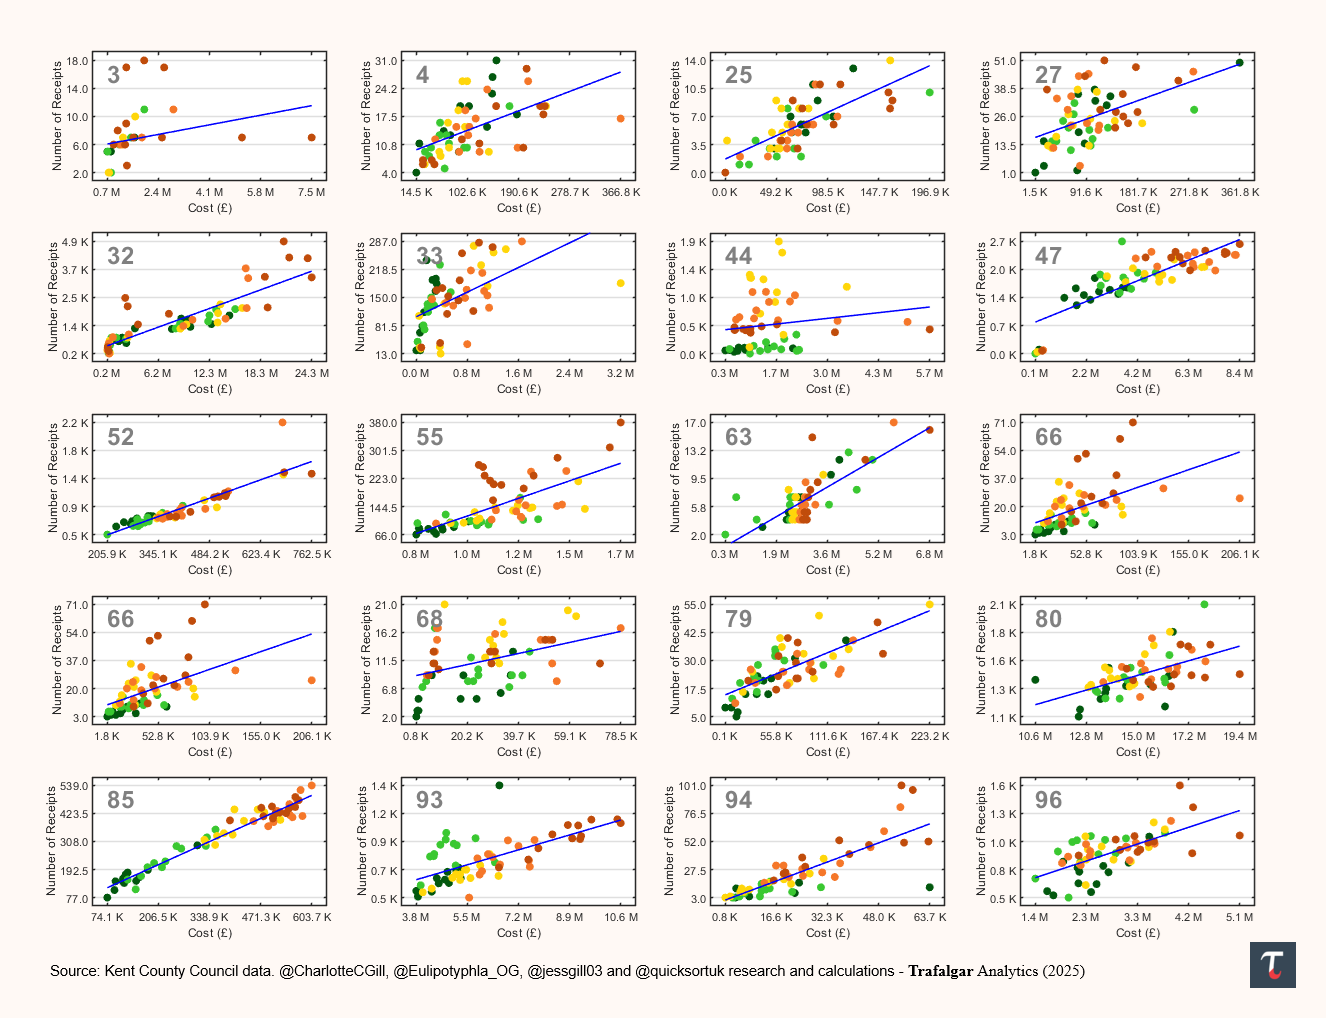
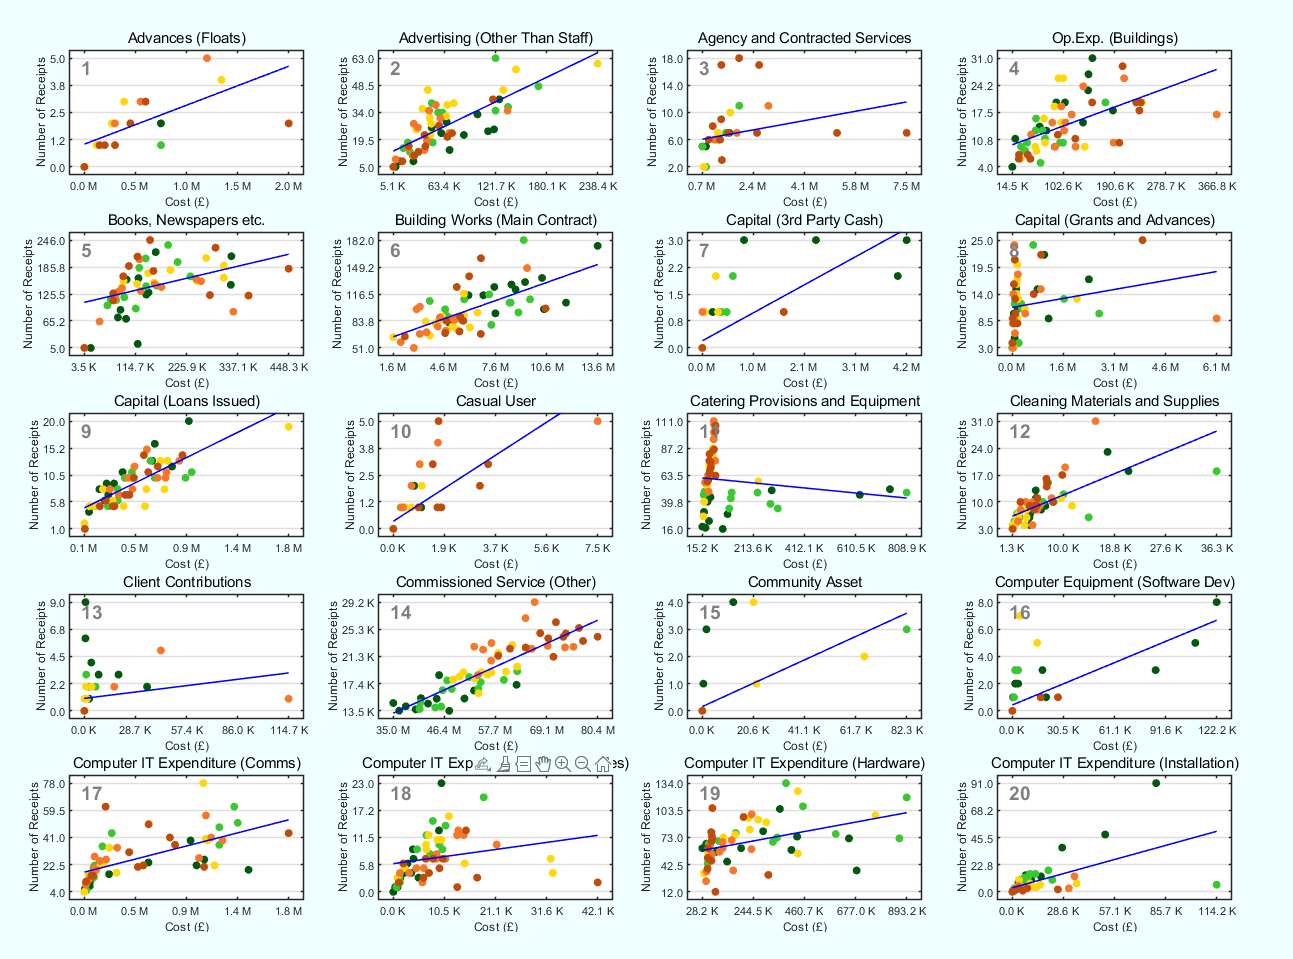
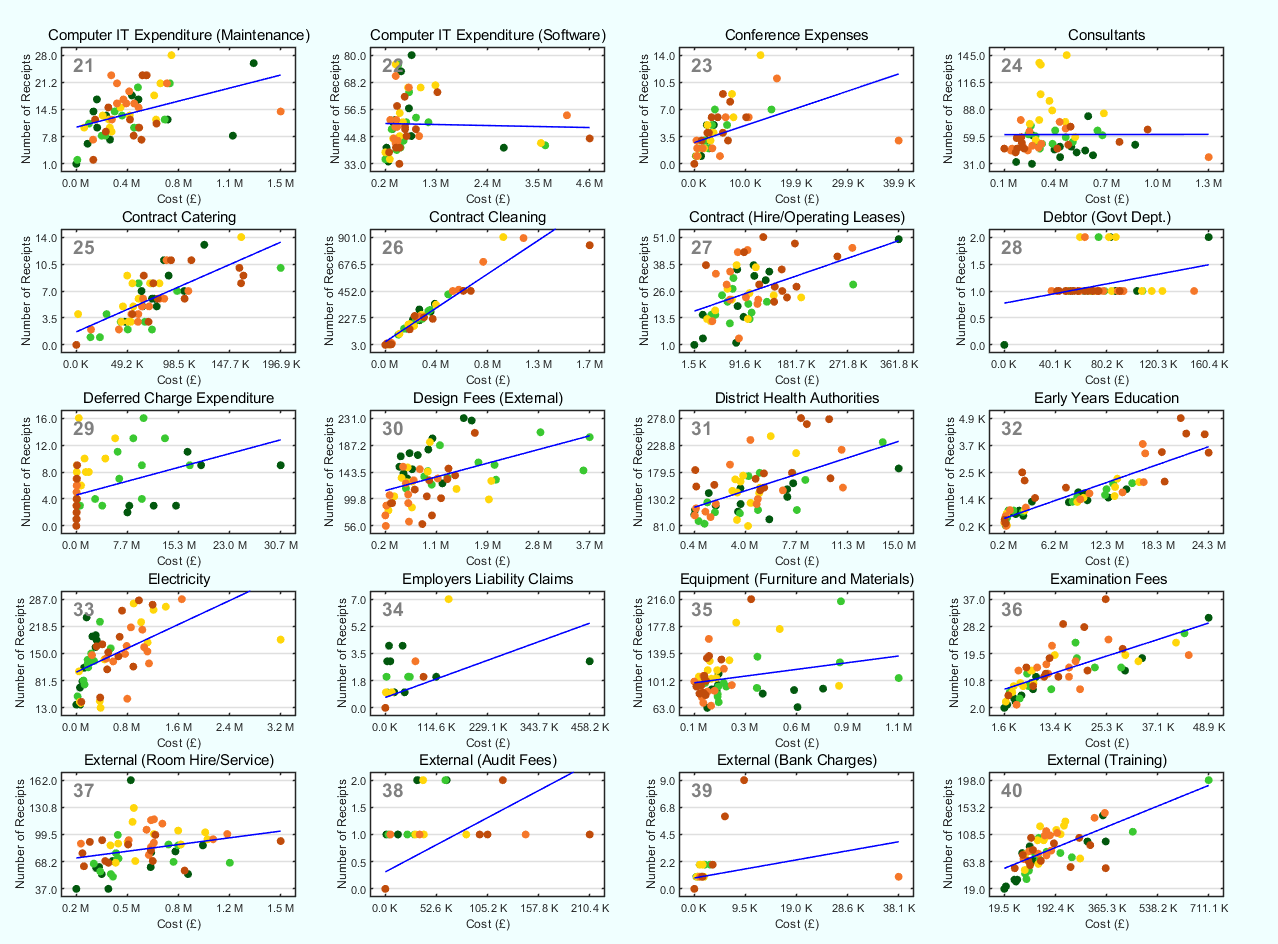
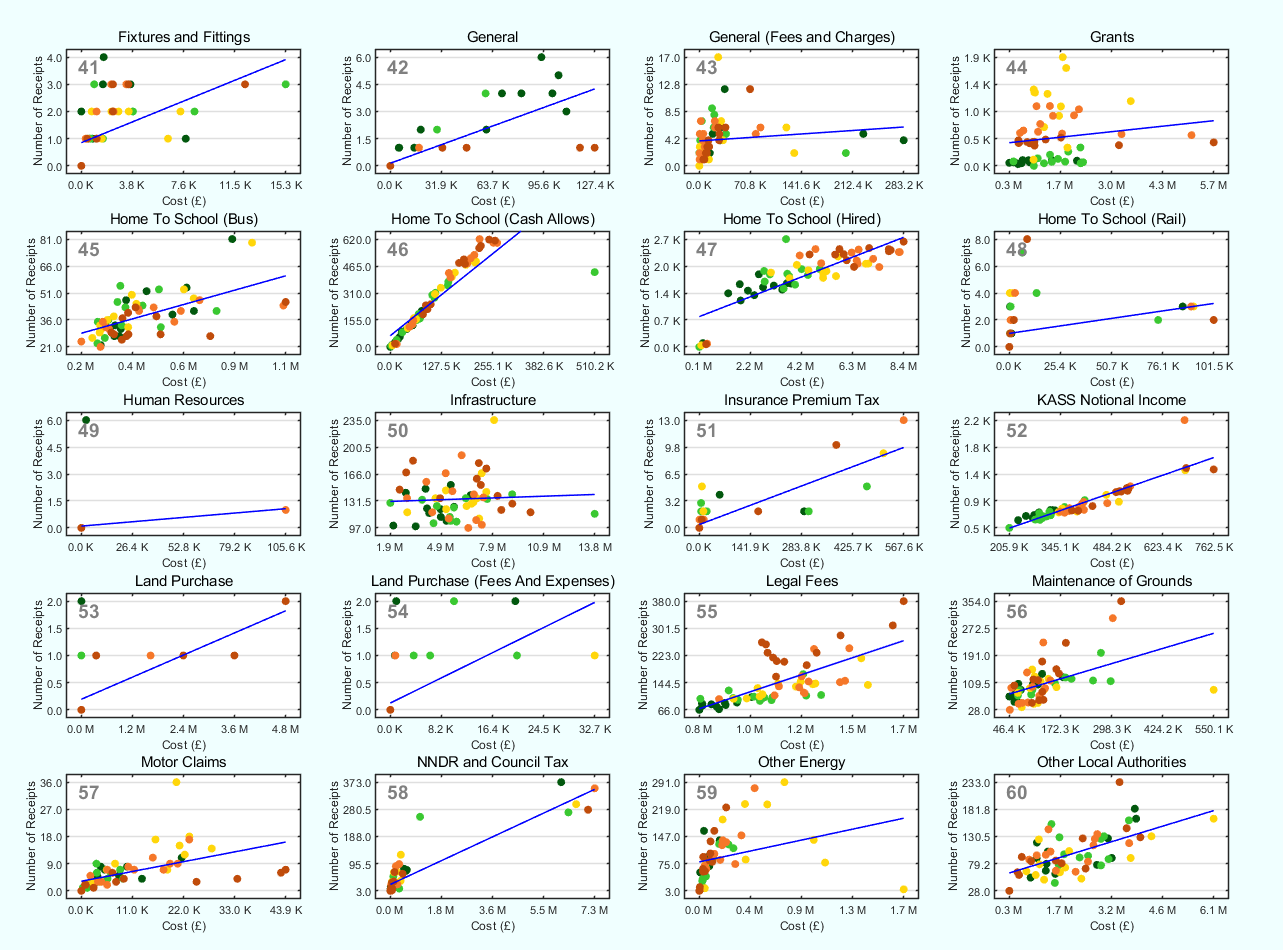
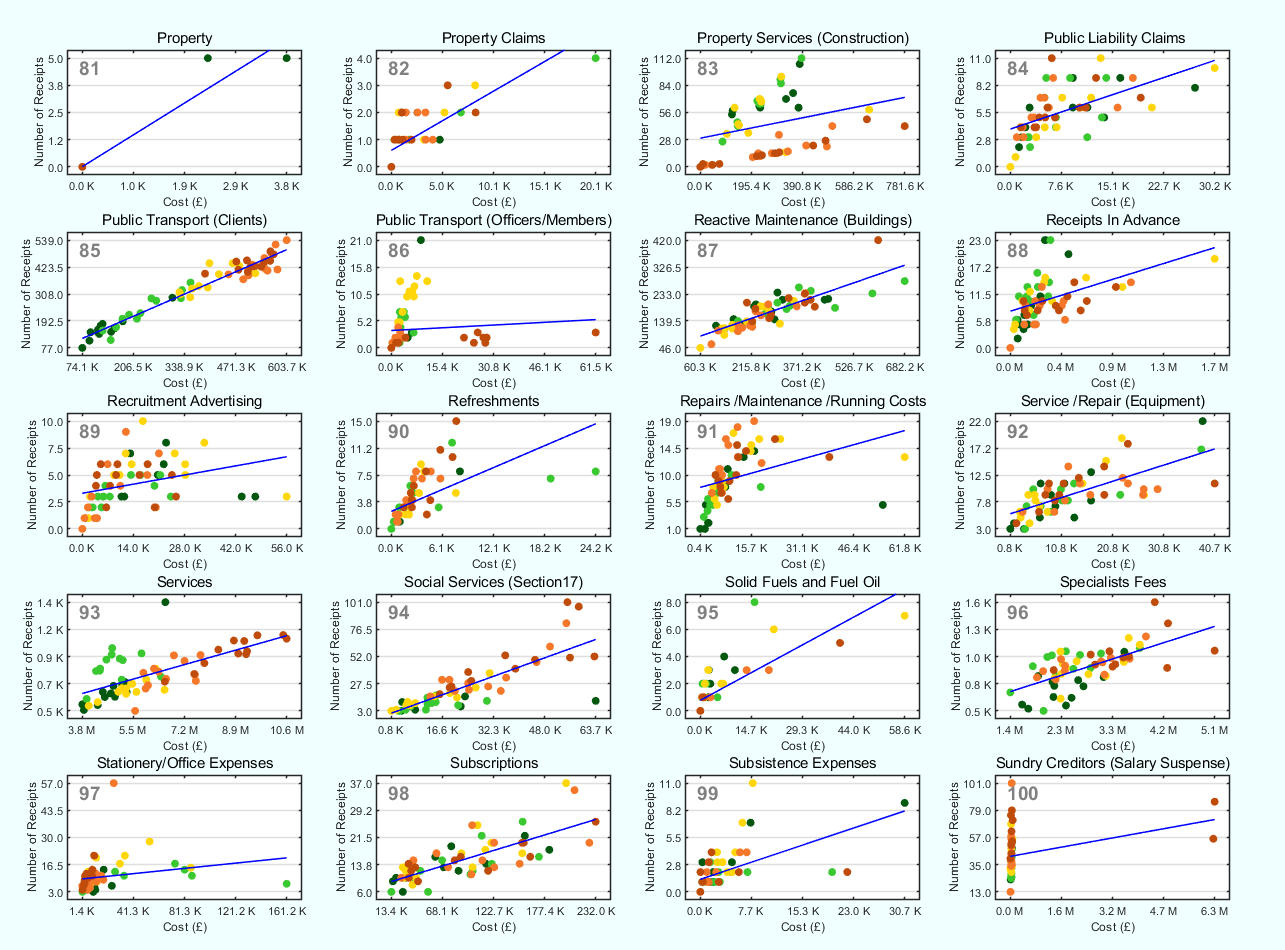
Appendix C — Regression Analysis
Appendix C uses weighted least squares regression to analyze costs versus receipt numbers each month, offering insights into spending changes over five years. We review monthly outgoings across 102 spending categories for the past five financial years.
For each category, the monthly spending and numbers of receipts are plotted, colour coded by financial year: 2020-21 (Dark Green), 2021-22 (Light Green), 2022-23 (Yellow), 2023-24 (Orange), 2024-25 (Maroon Red). A weighted least squares fit for each category is plotted, in dark blue.
Focus #1: Home-to-School Transport (HST) — Graphs 46 and 47 show both spending and receipt numbers surging in recent years.
Focus #2: Commissioned Service (Other) — As noted earlier, Graph 14 reveals steady growth in both spending and receipts.
Focus #3: Catering Provisions and Equipment — Here we see that whilst costs per month has come down, the number of receipts has jumped up substantially (Graph 11).
Focus #4: Legal Fees — Graph 55 shows both spending and receipts spiraling upward in recent years.
Similarly, spending on Private Contractors — Graph 80, Public Transport (clients) — Graph 85, and general Services — Graph 93 show increases in both dimensions.
Conversely there are some positive trends too, for Equipment (Furniture and Materials), we see reduced receipts and total spending in recent years — Graph 35. This trend makes sense, as furniture should have a long shelf life (no pun intended).
The category that does raise questions, is Deferred Charge Expenditure — Graph 29. Whilst it is a good thing that spending and receipts are down, the question is what was been deferred, and are there any other items currently being deferred?
This regression analysis reveals key insights into each spending category, particularly in the instances where the increased spending of a category stems from a surge in the volume of receipts paired with rising inflationary costs.

References
Wimble, D. (2025). You can change the way Kent County Council spend your money. [online] The Looker Newspaper. Available at: https://electionleaflets.org/leaflets/21047/.
Allegretti, A. (2025). Outgoing head of Reform’s ‘Doge’ urges party to avoid Musk’s mistakes. [online] Thetimes.com. Available at: https://www.thetimes.com/uk/politics/article/outgoing-head-of-reforms-doge-urges-party-to-avoid-musks-mistakes-qcmfhsndn [Accessed 12 Jun. 2025].
Finlay, S. (2025). New Reform UK council leader announces cuts to member allowances. [online] Kent Online. Available at: https://www.kentonline.co.uk/kent/news/new-reform-uk-council-leader-announces-cuts-to-member-allowa-324734/ [Accessed 12 Jun. 2025].
Consumer Price Inflation team (2025). CPIH INDEX 00: ALL ITEMS 2015=100. [online] www.ons.gov.uk. Available at: https://www.ons.gov.uk/economy/inflationandpriceindices/timeseries/l522/mm23.
Finlay, S. (2024). Care provider paid £63k to look after someone who had died. [online] Kent Online. Available at: https://www.kentonline.co.uk/kent/news/care-provider-paid-63k-to-look-after-someone-who-had-died-306901/ [Accessed 12 Jun. 2025].
 | A guest post by
|